Getting Started
The SoftPerfect Bandwidth Manager software consists of two components: a Bandwidth Control Service that processes network traffic and enforces bandwidth restrictions, and a Management Console used for configuration and monitoring. When you launch the Management Console it asks you to enter the name of the host where the Bandwidth Control Service is running and a password. By default, the host name is localhost and the password is blank. If you have installed the service on another computer, enter its IP address or name to access it.
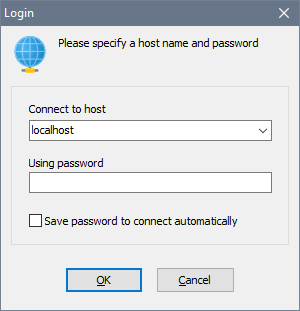
If you are getting the error messages like Connection Refused or Connection Timeout, it was most likely blocked by a firewall. In this case, you need to set it up to let the Bandwidth Manager connection through (TCP port 8701).
After a successful login, you will see the main window with a list of traffic filtering rules (initially blank):
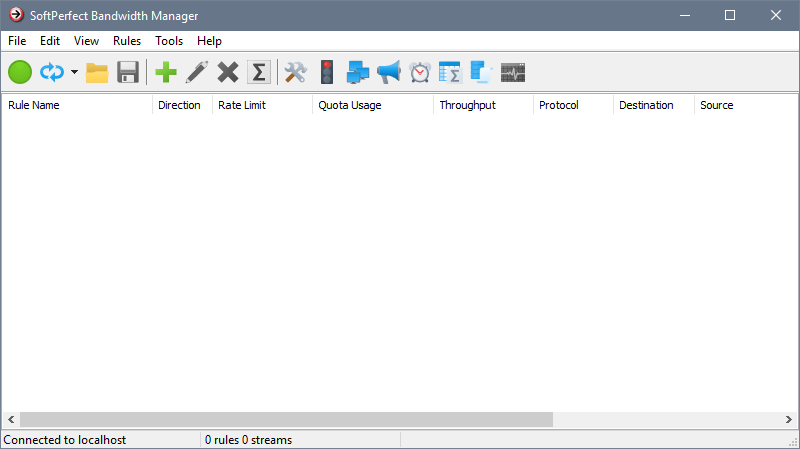
The toolbar buttons have the following functions:
| Connects to a local or remote service | |
| Refreshes the list of rules | |
| Imports all rules from a file. Use this to restore previously created rules or to configure multiple instances | |
| Exports all rules to a file. Use this to backup the existing rules or to configure multiple instances | |
| Adds a new rule | |
| Edits an existing rule | |
| Deletes an existing rule | |
| Displays rule’s usage information | |
| Opens the global settings | |
| Opens the group manager | |
| Opens the quota manager | |
| Opens the notification manager | |
| Opens the schedule manager | |
| Opens the usage reports | |
| Opens the event log | |
| Opens the live usage monitor |