I really trying to like version 7.0, but I miss the option to make the graph transparent, by hovering the mouse pointer over it.
Also, if I choose the usage graph option on tray icon click, and then click on the tray icon, a second graph opens and the only way to remove it is by closing NetWorx. Clicking a second time removes both graphs.
Why are so many of the long term features missing from version 7.x?
Also, where are the instructions for downgrading back to version 6?
SoftPerfect NetWorx
Second graph opens on icon click
Started by Jeremy
|
Jeremy
Second graph opens on icon click 20 May 2022, 10:09 |
|
|
Re: Second graph opens on icon click 20 May 2022, 10:22 |
Admin Registered: 10 years ago Posts: 889 |
As you may be aware, version 7 is a total rewrite of the product that has been in existence for 20 years. The option to make the graph transparent by hovering the mouse pointer has not been implemented (yet). If there is more demand for it from our users, we will implement it, but otherwise we'd like to keep the product as simple as possible.
From your description, it sounds like you wish to keep the graph on the screen all the time. In that case, it may be better to have it displayed in the taskbar using the taskbar extension.
Regarding the second graph appearing upon click, it sounds like you are monitoring more than one network adapter. Please check the Settings - Main tab, as shown below. In version 7 there is one graph per adapter, as many users requested, so with two monitored adapters there would be two graphs. If you wish to monitor just one adapter and thus have one graph for it, press the Settings... button next to the adapter list and select the one you want.
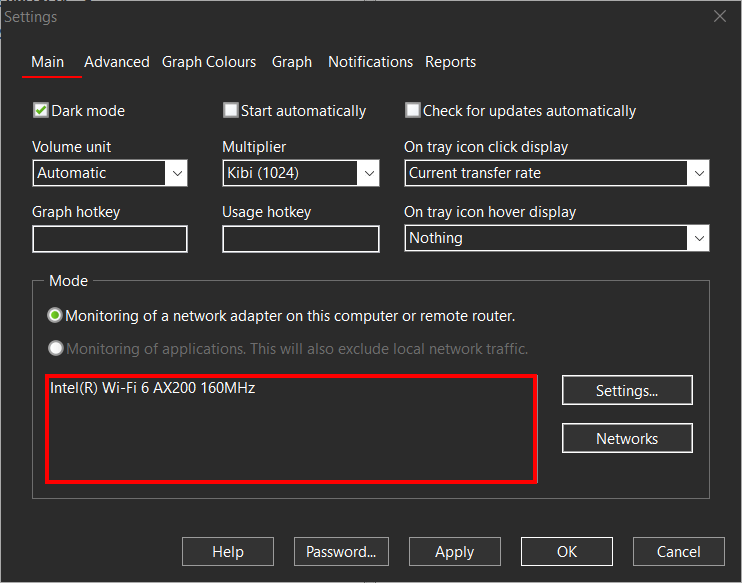
If you prefer to keep using version 6, please see this post for version 6 download links.
From your description, it sounds like you wish to keep the graph on the screen all the time. In that case, it may be better to have it displayed in the taskbar using the taskbar extension.
Regarding the second graph appearing upon click, it sounds like you are monitoring more than one network adapter. Please check the Settings - Main tab, as shown below. In version 7 there is one graph per adapter, as many users requested, so with two monitored adapters there would be two graphs. If you wish to monitor just one adapter and thus have one graph for it, press the Settings... button next to the adapter list and select the one you want.
If you prefer to keep using version 6, please see this post for version 6 download links.