NetWorx Online User Manual
Getting started
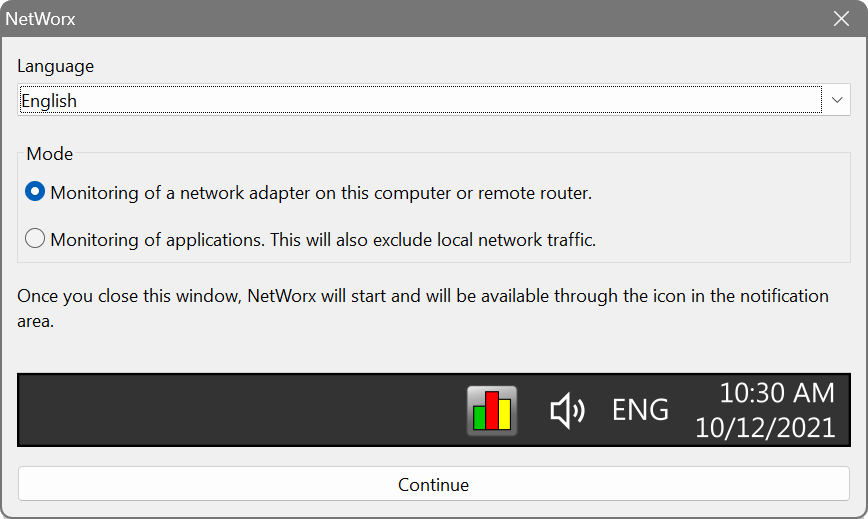
Upon the first launch, NetWorx will display a welcome dialog where you can choose the language and the monitoring mode that better suits your needs:
- to monitor a local network adapter or a network interface on the router (this option will not let you see what apps are using your connection), or
- to monitor network apps on your computer and disregard any local traffic (this option is not available in the portable package).
You can change your initial selection in the settings later.
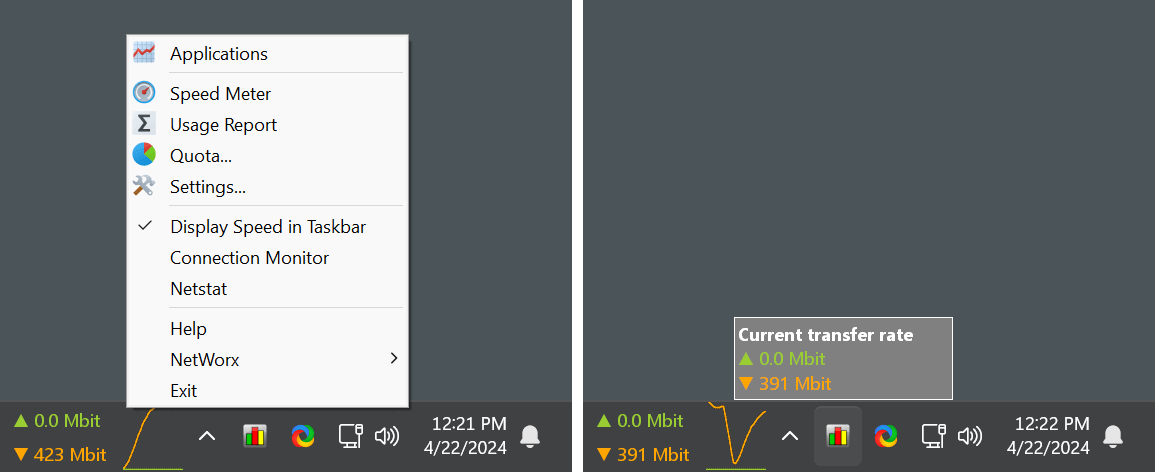
After the welcome dialog, NetWorx will be running in the notification area on Windows and in the menu bar on macOS. If you have more than one screen connected to your computer, check all of them to locate NetWorx icon in the notification area or menu bar. The icon is important — it provides access to all NetWorx features: right-clicking the icon opens the main menu, while a left-click shows the current transfer rate.
If you do not see NetWorx icon on Windows, click the Show hidden icons upward-pointing arrow next to the notification area. You can also right-click any empty space on the taskbar, then click Taskbar settings, and set NetWorx icon to On. Please refer to “Customize the taskbar notification area” Microsoft page for more help with hidden icons.
Real-time monitoring
NetWorx real-time connection usage is shown on a floating graph accessible via the top item in the popup menu.
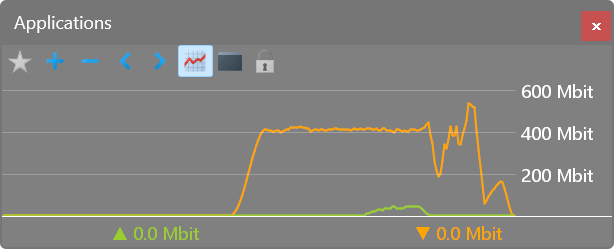
Additionally, on Windows the upload/download speed can be shown in the taskbar, while on macOS it can be shown in the menu bar.
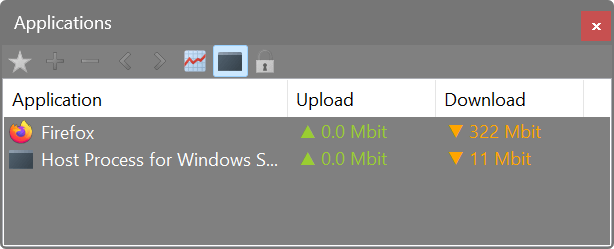
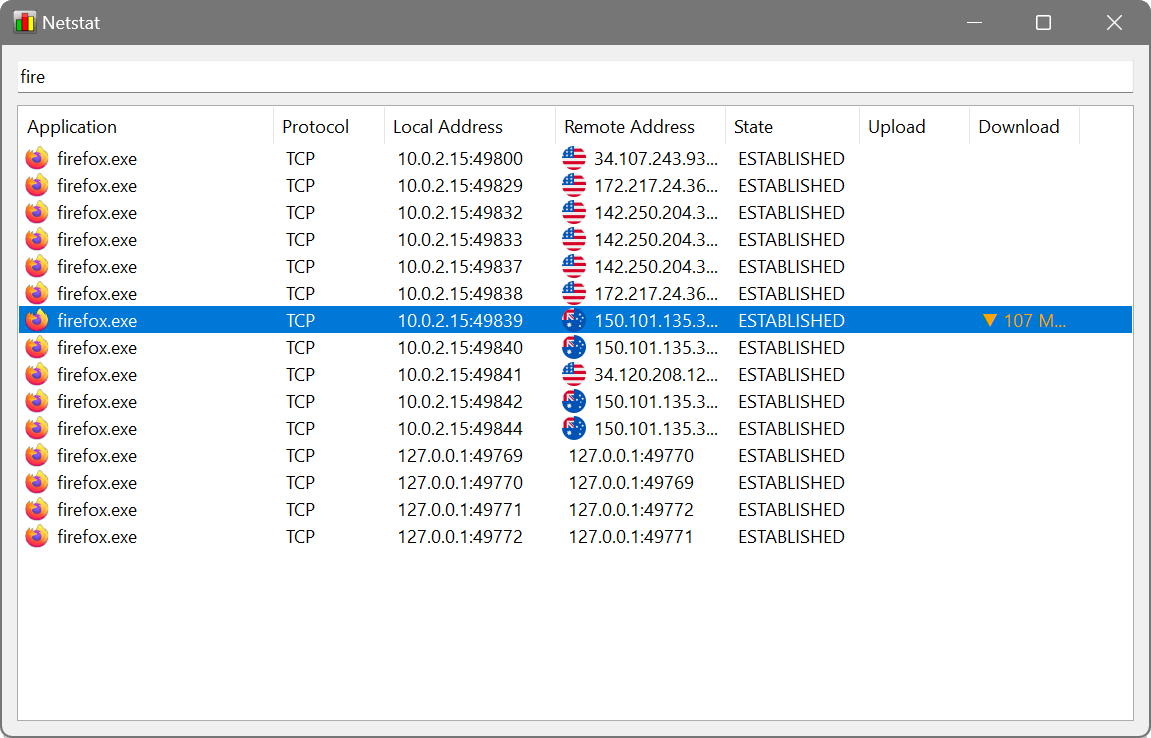
NetWorx comes with an enhanced netstat tool that shows network-accessing apps in real-time with their connections and transfer speeds:
Long-term usage data
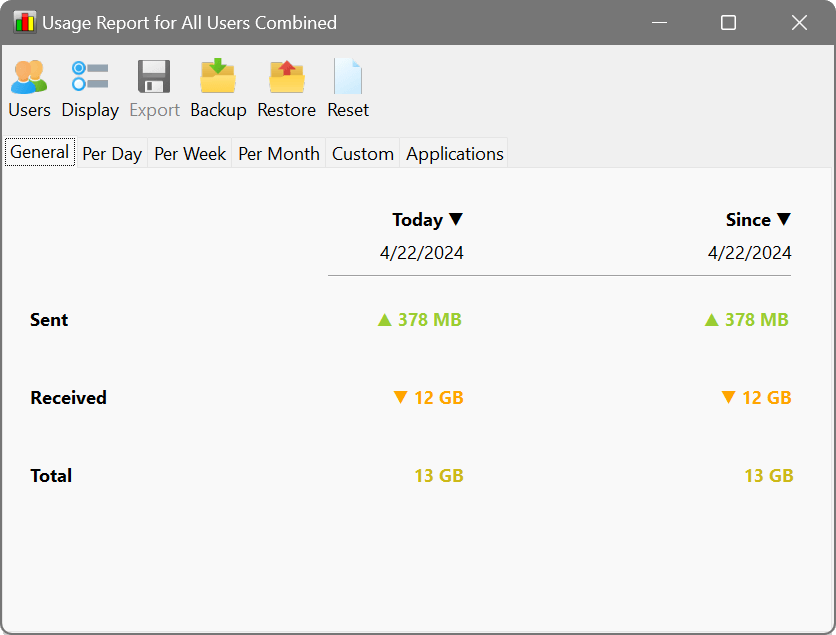
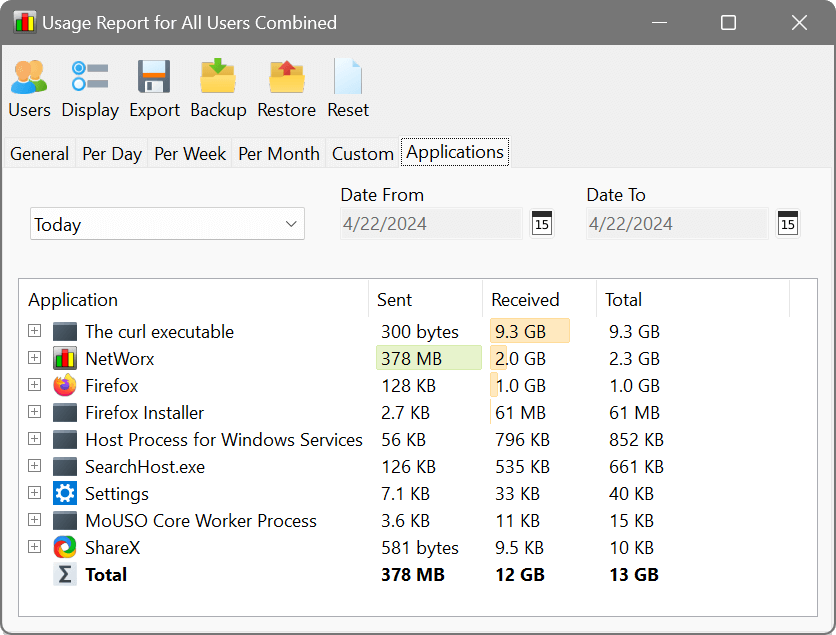
Aggregated usage data by day, week and month, as well as per-application reports are available in Usage Report:
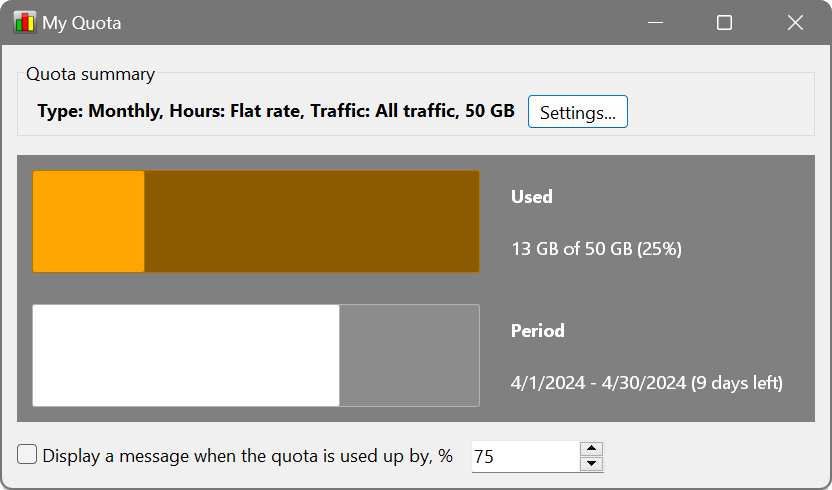
If you have a usage quota imposed by your ISP, you may find the Quota feature handy. It can notify you when your usage is nearing the threshold:
Settings
Most aspects of NetWorx operation and appearance can be customised. For example, in the Settings you can change the monitoring mode initially selected in the welcome dialog:
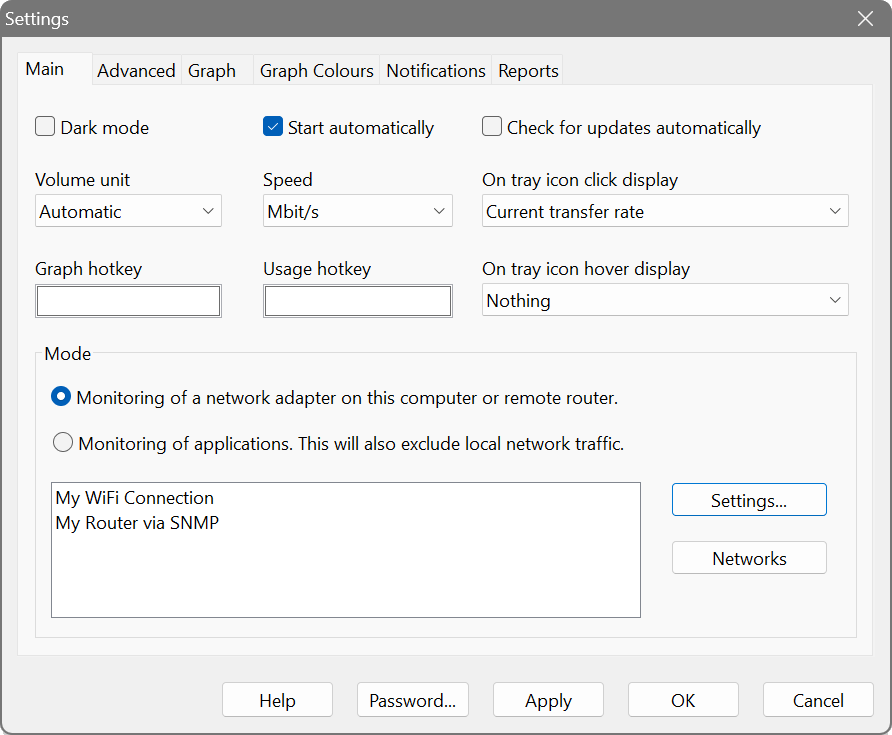
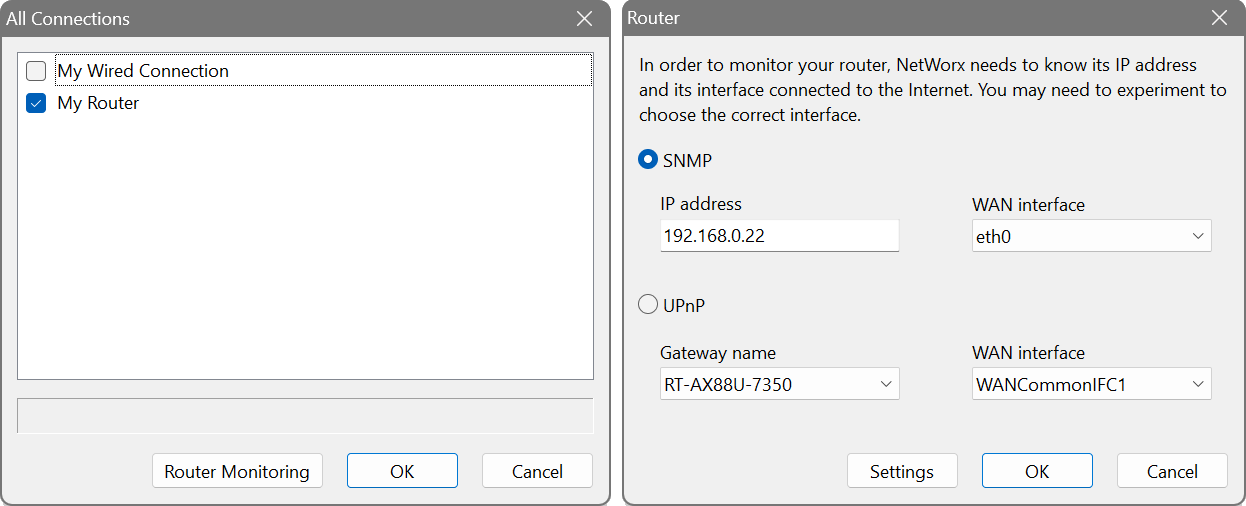
The Settings button allows you to choose network adapters to be monitored, as well as set up router monitoring. Most routers that support SNMP or UPnP can be monitored.
SNMP protocol version, community string and access credentials can be configured in Router Monitoring – Settings.
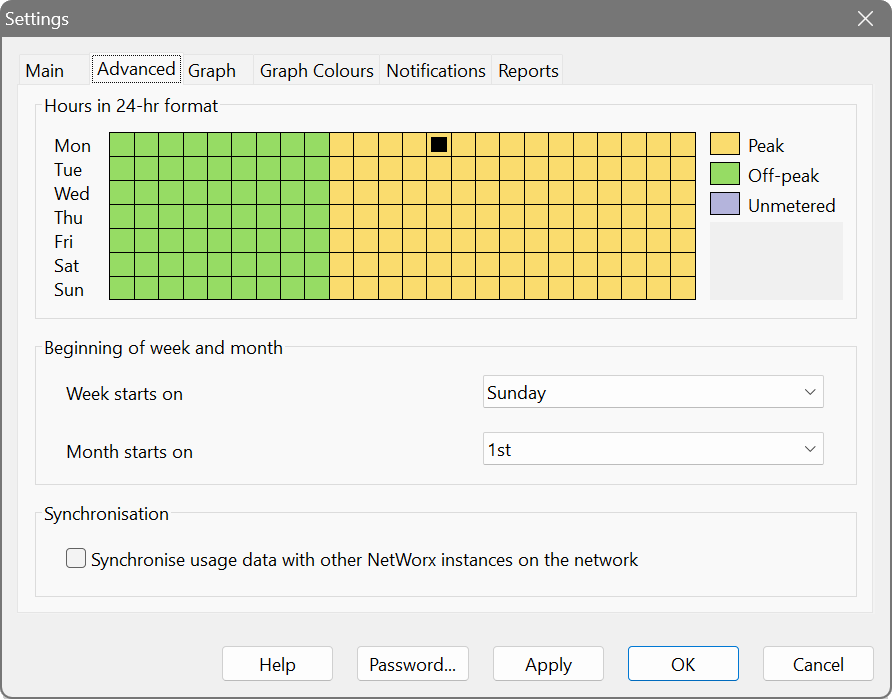
The Advanced settings include the first day of week and month, so that you can align NetWorx reporting with your ISP billing. If you have multiple computers, the synchronisation option will synchronise usage records between NetWorx instances in a peer-to-peer manner. When the sync is enabled, there will be an additional tab in the usage reports detailing the per-computer usage.
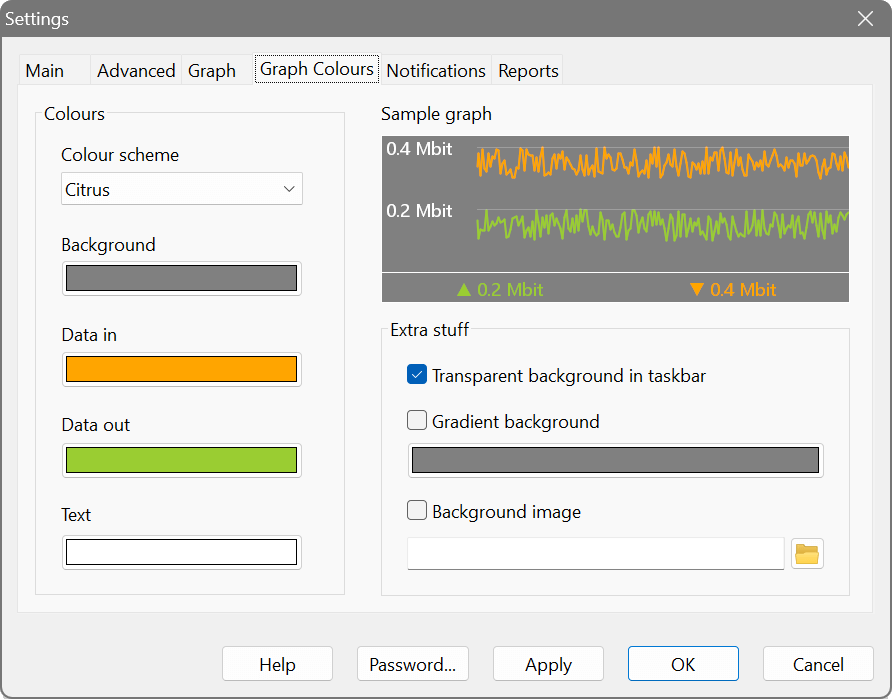
In the Graph Colours section you can customise the colours of the graph:
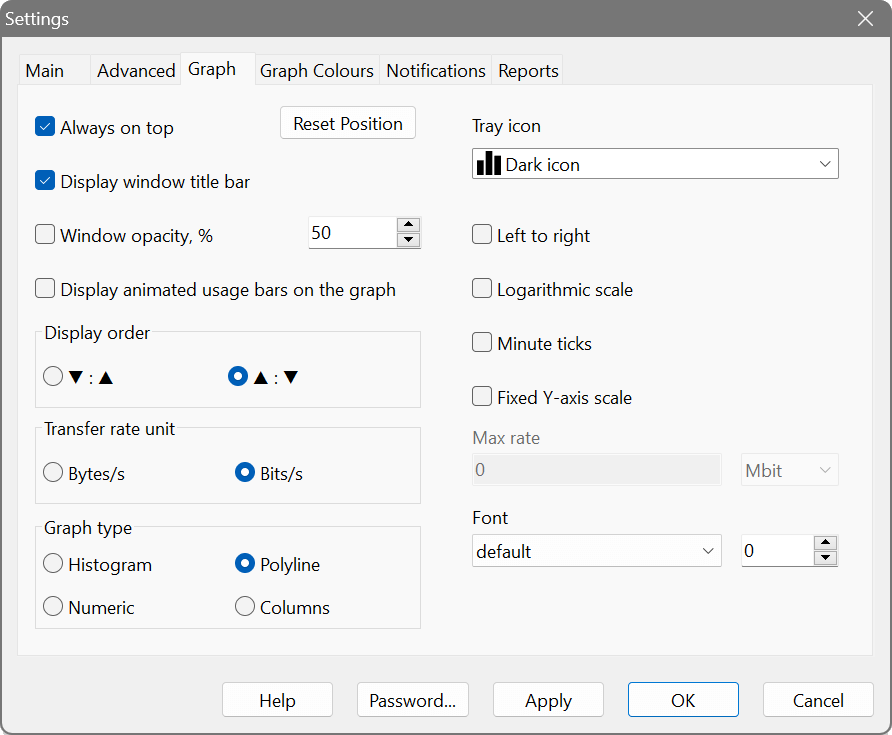
The Graph section allows you to further customise the appearance of the graph and the display preferences:
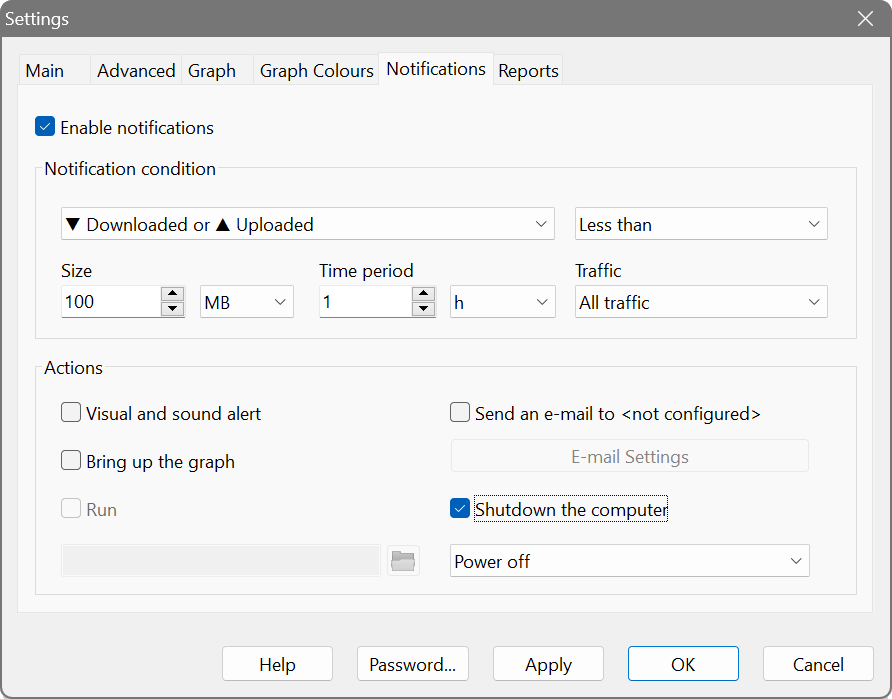
The Notifications section allows you to define the actions that occur when too much or too little data was transferred. For instance, this can be used to turn the computer off when a large download or upload completes:
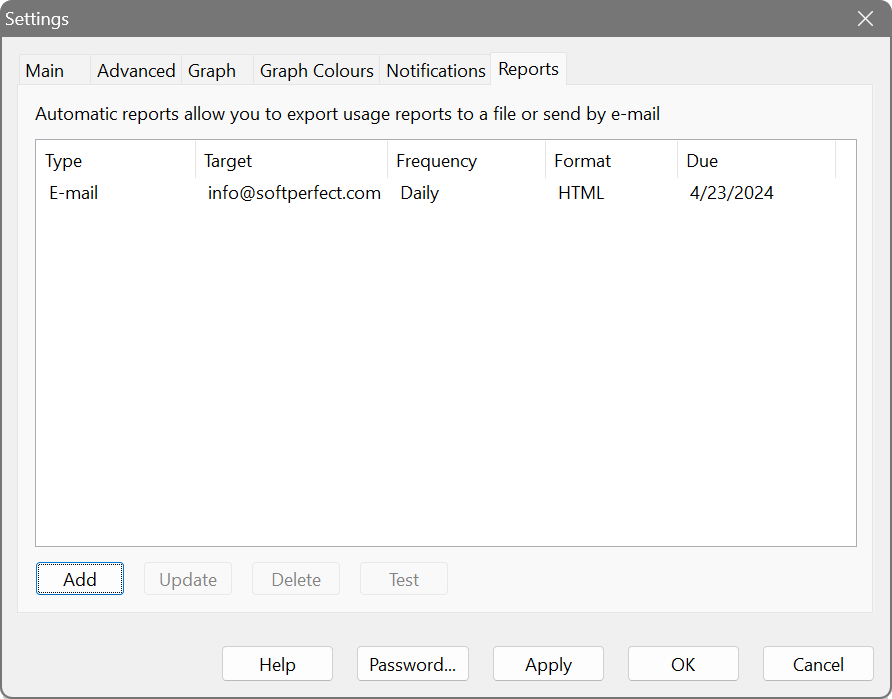
Lastly, the Reports section lets you set up one or more automatic reports that are e-mailed or written to a file. For example, this can be used to receive an e-mail with usage figures at the end of the day:
Connection quality monitoring
There are built-in tools for tracking the performance of your Internet connection.
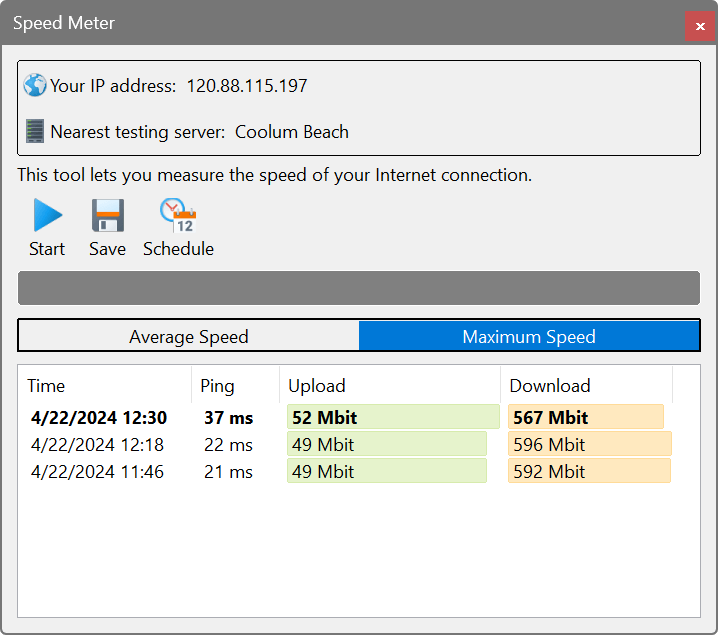
One is the Speed Meter, which actively tests the speed of your connection. It uploads and downloads a set of random data to a nearby server and records the speed. The speed tests can be run on a schedule as frequently as every 5 minutes. Please note that this will affect your data usage allowance.
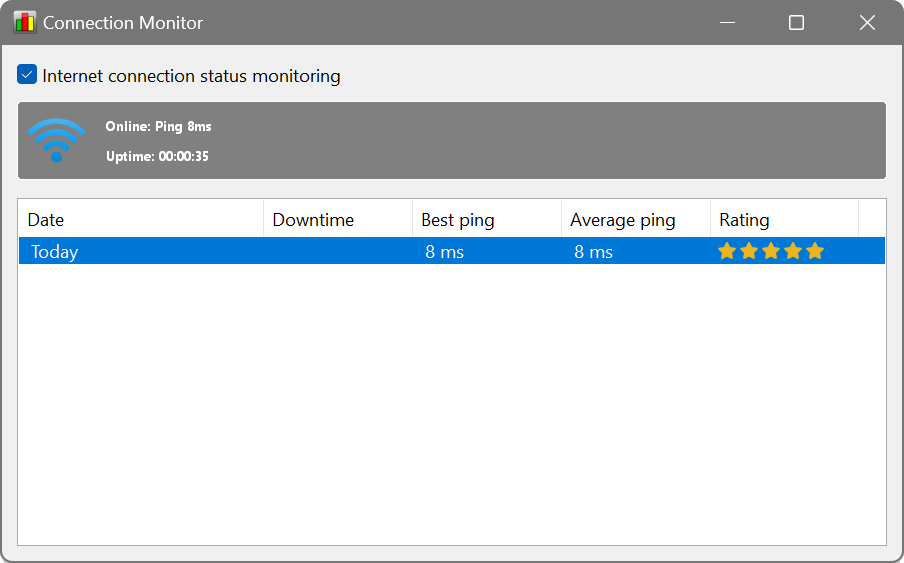
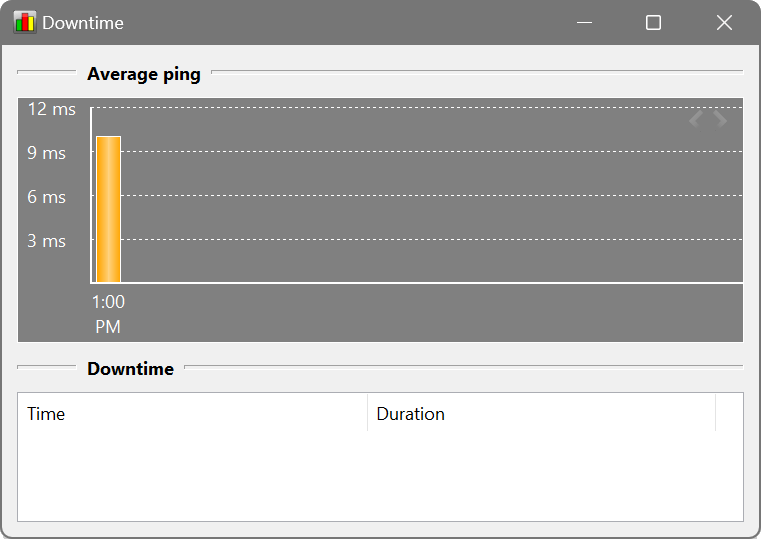
The other tool is the Connection Monitor, which lets you see how your connection performs. It pings a set of highly-available nearby servers and records your ping times and any downtime. A quality Internet connection has a low ping and near-zero downtime.
Monitoring of multiple computers
NetWorx can only monitor Internet usage on the computer where it is installed. If you want to monitor multiple computers, you have two options:
- Install NetWorx on every computer in your network. This can only be done if all your computers are running Windows or macOS. While NetWorx can only monitor the usage on the computer it is installed on, the instances of NetWorx can talk to each other so that each instance is synchronised and shows the actual overall usage. In this case, devices like iPads, Smart TV or mobile phones will not be metered. This synchronisation must be turned on in the settings.
- If your router supports SNMP or UPnP protocol, you can monitor all traffic via your router. This however will not give you a per-device usage breakdown and the monitoring computer must be continuously on to poll the router and collect usage data.
End User Licence Agreement (EULA)
This software and the included documentation is copyright SoftPerfect Pty Ltd, Australia. All rights are reserved. The software may be used, installed or copied only in accordance with the terms of the licence described in the following paragraphs.
DISTRIBUTION TERMS
The evaluation version of the software may be freely distributed, provided that the original distribution package is not modified in any way.
EVALUATION VERSION
This is not free software. You are hereby licensed to use this software for evaluation purposes without charge. The evaluation version may be of a limited duration, or have some features limited or disabled. To use the software without these restrictions, you need to purchase a licence.
GRANT OF LICENCE
The software is licensed, not sold. Upon purchase of a licence, SoftPerfect grants you a non-exclusive, non-transferable right to use the software and all its features according to the terms of this EULA and the purchased licence type as described in the Licence Types section.
LICENCE TYPES
- Single Device Licence grants the purchaser, or agents of the purchaser, rights to install and use the software on one device only (e.g. computer, server, USB flash drive or virtual machine) at any given time. The licence can be reinstalled on the same device at any time, or deleted from one device and then moved to another. It can be used on any operating system compatible with the software. To install and use the software on more than one device simultaneously, you must purchase the corresponding number of single device licences or one of the special licences listed below.
- Multiple Licence Pack grants the purchaser, or agents of the purchaser, rights to simultaneously install and use the software on up to as many devices as is stipulated by the quantity in the pack. For example, the “Up to 10 Devices” pack allows installing and using the software on up to ten devices at the same time. Each device licence within the pack is identical to a single device licence. The licence pack can be used across multiple devices running different operating systems compatible with the software.
- Site Licence grants an organisation, or agents of an organisation, rights to install and use the software on an unlimited number of devices within one organisation site, including any cloud-based installation and use performed from that site. An organisation site is defined as a location, or group of locations, used by the organisation that are all within 100 miles (160 kilometres) of each other.
- Worldwide Licence grants an organisation, or agents of an organisation, rights to install and use the software on an unlimited number of devices at an unlimited number of locations used by the organisation, including any cloud-based installations and use performed from those locations. If not listed, please contact us for the worldwide licence price.
- OEM Licence grants an organisation, or agents of an organisation, rights to use and distribute the software with their own hardware or software products. These products must provide substantial additional functionality to this software beyond mere rebranding, and not include any potentially unwanted programs.
Where applicable, additional licence subtypes include:
- Home Licence grants a private individual rights to install and use the software at home, that is in a place of residence, for domestic purposes with no intention to generate income.
- Business Licence grants an organisation (a company, corporation, firm, enterprise or institution, or part thereof) or a person rights to install and use the software in a commercial and non-commercial environment for the purposes of or in connection with running a business, supplying products or services to other organisations or individuals, or generating income.
DISTRIBUTION OF LICENCE KEYS
Except for the specific purposes described in the Grant of Licence and the Licence Types sections, licence keys issued by SoftPerfect may not be distributed by any person, organisation or their agents without written permission from the copyright holder.
MODIFICATIONS
Unauthorised modification, decompilation or reverse engineering of the software or any subset of the software without written permission from the copyright holder is strictly prohibited.
USE
This software is distributed “as is”. No warranty of any kind is expressed or implied. You use it at your own risk. In no event shall SoftPerfect or its agents be liable for any loss or inaccuracy of data, loss or interruption of use, or cost of procuring substitute technology, goods or services, or any other loss or damages. If, despite the foregoing, SoftPerfect is found liable for any damages, its total cumulative liability shall not exceed the amount paid by you for the software licence.
You may not use this software in connection with any illegal, fraudulent, infringing, harmful or offensive activity.
TERMS OF ACCEPTANCE
Installation or use of this software signifies your acceptance of the terms and conditions of the licence. If you do not agree with them, you must stop using and remove the software from your devices. SoftPerfect reserves all rights not expressly granted here. SoftPerfect also reserves the right to terminate this licence immediately if you fail to comply with these terms. Upon termination, you must cease all use of the software and uninstall it from your devices.
GOVERNING LAW AND JURISDICTION
This EULA shall be governed by and construed in accordance with the laws of the State of Queensland, Australia, without regard to its conflict of law principles. The parties agree that the courts of Queensland, Australia, shall have the exclusive jurisdiction to resolve any dispute arising from or in connection with this EULA.