Hi Andrew,
I've started using the "Time Zone Offset (mins)" with a value of 240 (4 hours) to represent the difference between UTC (Universal Time Clock) used by my ISP and local time EDST (Easter Daylight Savings Time) on my PC.
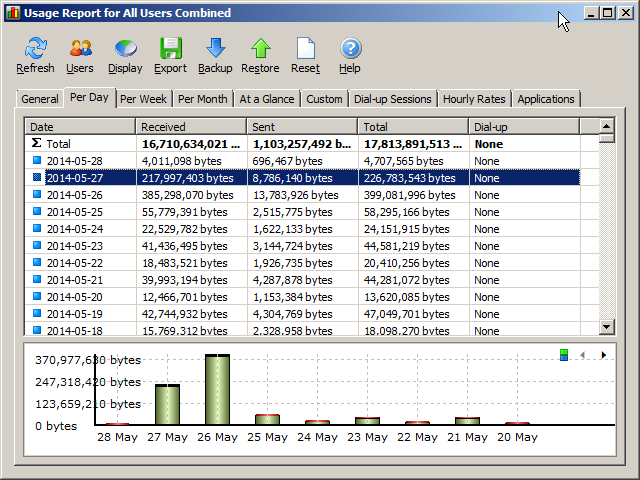
This is working well with the Usage Report, at 20:00 it begins to report the Date as the "next day" and the traffic for that "day".
However that the graph doesn't reflect the new Date and Data once local time has gone past 20:00 local time, it doesn't change until local time has gone past midnight. Then it reports the correct Date, and correctly includes Data starting at 20:00 the "previous day".
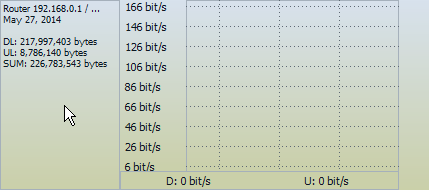
I took 3 screenshots, seconds apart at around 21:16, which show the graph still reporting the date as May 27 and the usage only up to 20:00 during the last 4 hours of the 27th, while the usage report is correctly showing the date of May 28 has begun and includes data between 20:00 and 00:00 of the 27th as belonging to May 28.
If it's not too much trouble, could you force the graph to show the Date & Data for the most recent "Day" row in the database?
Thanks,
J
All Forums
> NetWorx
> Current topic
Adjust graph to reflect the use of the Time Zone Offset
Started by Praxis
|
Adjust graph to reflect the use of the Time Zone Offset 28 May 2014, 12:25 |
Registered: 13 years ago Posts: 241 |
|
|
Re: Adjust graph to reflect the use of the Time Zone Offset 28 May 2014, 13:18 |
Admin Registered: 18 years ago Posts: 3 519 |
|
Re: Adjust graph to reflect the use of the Time Zone Offset 28 May 2014, 21:38 |
Registered: 13 years ago Posts: 241 |
Yes, that's right Andrew.
I'd like the top totals of the most recent day on the "Day" tab to show in the graph. As soon as the "Day" tab starts to record the "next" day (the 28th in the screenshot) I'd like the graph to show the same totals.
I know that if I wanted the total for a "Day", midnight to midnight local time, which isn't ever likely to happen, I could use the "Hours" tab...etc.
Unless you also add some "Time" boxes to the "Custom" tab so that I could select for example:
from 2014-05-26 21:00 (i.e. up to 4 "hours" rows, for the UTC = midnight beginning May 29th)
..to.. 2014-05-27 20:59 (i.e. up to 20 "hours" rows, for the UTC = midnight ending May 29th)
which would produce a single row (or two "Day" rows, one for up to 4 hours, the other up to 20 hours, plus the aggregate total which is all that I'd really want)
Actually only the HH would be required with the program assuming ":00" for the starting time from and ":59" for the ending time to as:
from 2014-05-26 21 (i.e. up to 4 "hours" rows, for the UTC = midnight beginning May 29th)
..to.. 2014-05-27 20 (i.e. up to 20 "hours" rows, for the UTC = midnight ending May 29th)
Thanks,
J
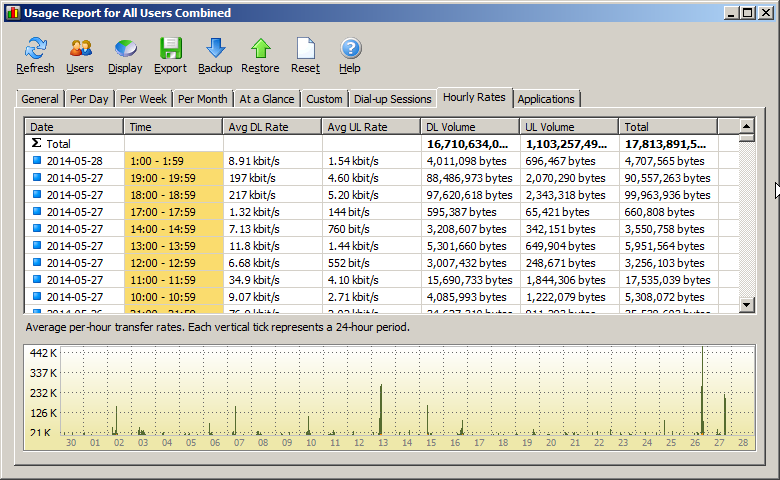
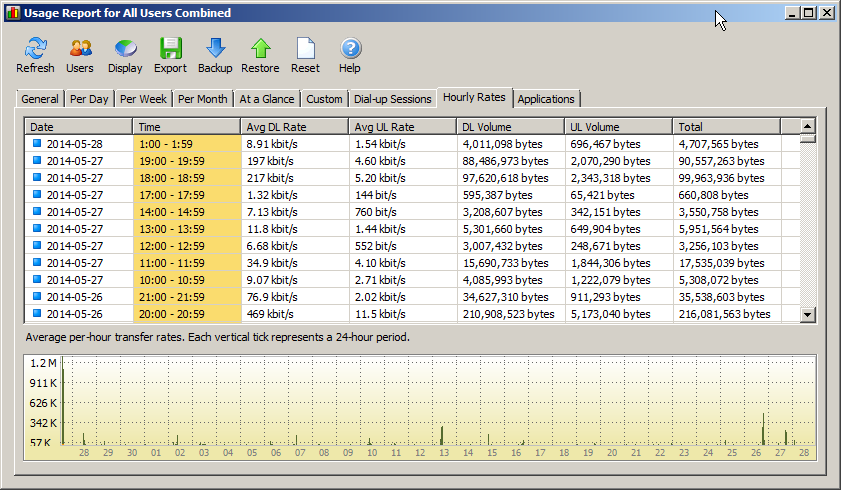
PS In the screenshot of the "Hours.." tab, to get the total for the 27th midnight to midnight, I'd get the sum of
1 row for 2014-05-26 21:00 - 21:59
8 rows for 2014-05-27 10:00 - 10:59 to 19:00 - 19:59
I'd like the top totals of the most recent day on the "Day" tab to show in the graph. As soon as the "Day" tab starts to record the "next" day (the 28th in the screenshot) I'd like the graph to show the same totals.
I know that if I wanted the total for a "Day", midnight to midnight local time, which isn't ever likely to happen, I could use the "Hours" tab...etc.
Unless you also add some "Time" boxes to the "Custom" tab so that I could select for example:
from 2014-05-26 21:00 (i.e. up to 4 "hours" rows, for the UTC = midnight beginning May 29th)
..to.. 2014-05-27 20:59 (i.e. up to 20 "hours" rows, for the UTC = midnight ending May 29th)
which would produce a single row (or two "Day" rows, one for up to 4 hours, the other up to 20 hours, plus the aggregate total which is all that I'd really want)
Actually only the HH would be required with the program assuming ":00" for the starting time from and ":59" for the ending time to as:
from 2014-05-26 21 (i.e. up to 4 "hours" rows, for the UTC = midnight beginning May 29th)
..to.. 2014-05-27 20 (i.e. up to 20 "hours" rows, for the UTC = midnight ending May 29th)
Thanks,
J
PS In the screenshot of the "Hours.." tab, to get the total for the 27th midnight to midnight, I'd get the sum of
1 row for 2014-05-26 21:00 - 21:59
8 rows for 2014-05-27 10:00 - 10:59 to 19:00 - 19:59
|
|
Re: Adjust graph to reflect the use of the Time Zone Offset 02 June 2014, 16:53 |
Admin Registered: 18 years ago Posts: 3 519 |
I have updated NetWorx so it should now correctly display time frame and usage info when a timezone offset is used. Please give it a go and let me know how it works for you.
|
Re: Adjust graph to reflect the use of the Time Zone Offset 03 June 2014, 00:06 |
Registered: 13 years ago Posts: 241 |

|
Hans G
why not have the program recognise local date & time 21 June 2016, 10:57 |