I have recently started to use the Report facility in Networx but I have noticed that the usage in a daily Report is not consistent with that in the "Per Day" usage tab.
Do the usage stats in the Report ignore unmetered hours in the same way as "Per Day" usage does or is the Report measuring something else?
Regards,
Rod
All Forums
> NetWorx
> Current topic
Usage report inconsistencies
Started by Rod
|
Rod
Usage report inconsistencies 26 February 2016, 10:51 |
|
Re: Usage report inconsistencies 26 February 2016, 23:28 |
Registered: 14 years ago Posts: 241 |
Hi Rod,
Networx stores all dates and times in UTC (Greenwich, England is the base time)
Networx has a setting for [Time zone offset (mins)], mine is 300 minutes = 5 hours during EST (my time zone for Ontario, Canada).
This changes to 4 hours when we switch to DST in March.
Therefore, now, at 19:00 EST on the 24th, networx adds 300 minutes, gets 00:00 UTC and starts a new day by adding 1 to the date giving 25th.
Adding up by just using the date (for example the 25th) is really adding up from 7pm of the 24th until 7pm of the 25th local time which is when the Report is produced.
Selecting the [Custom] tab and then the date of the 25th:
total from [Custom] tab = 81.88 and,
total from [Per Day] tab = 81.88 and,
total from adding up [Hours] = 81.88 all agree.
However my Daily Report for the 25th, created at 7pm on the 25th local time (00:00 on the 26th UTC), shows 73.10, which is low by 8.78.
I exported the hourly data to a csv file but couldn't reconcile the difference.
(Well I could get 73.10 if I took the total Downloaded, 73.45 and reduced that by the Total Up+Down for the last hour, 0.65, but that's way too weird to contemplate .)
.)
However, I'll check the totals for the 26th and report back.
J
Networx stores all dates and times in UTC (Greenwich, England is the base time)
Networx has a setting for [Time zone offset (mins)], mine is 300 minutes = 5 hours during EST (my time zone for Ontario, Canada).
This changes to 4 hours when we switch to DST in March.
Therefore, now, at 19:00 EST on the 24th, networx adds 300 minutes, gets 00:00 UTC and starts a new day by adding 1 to the date giving 25th.
Adding up by just using the date (for example the 25th) is really adding up from 7pm of the 24th until 7pm of the 25th local time which is when the Report is produced.
Selecting the [Custom] tab and then the date of the 25th:
total from [Custom] tab = 81.88 and,
total from [Per Day] tab = 81.88 and,
total from adding up [Hours] = 81.88 all agree.
However my Daily Report for the 25th, created at 7pm on the 25th local time (00:00 on the 26th UTC), shows 73.10, which is low by 8.78.
I exported the hourly data to a csv file but couldn't reconcile the difference.
(Well I could get 73.10 if I took the total Downloaded, 73.45 and reduced that by the Total Up+Down for the last hour, 0.65, but that's way too weird to contemplate
.)
However, I'll check the totals for the 26th and report back.
J
|
Re: Usage report inconsistencies 27 February 2016, 04:04 |
Registered: 14 years ago Posts: 241 |
Problem solved, the Reports report the 'raw' traffic whereas the Usage Report multiplies the 'raw' numbers by the [Usage adjustment (factor)].
In my example above the raw was 73.1 which, when multiplied by my factor 1.12, gives 83.1
Currently the table [Usage] contains the 'raw' values.
This may or may not be a problem, depending on how you look at having a [Usage adjustment (factor)] other than 1.0.
Typically you set this and leave it 'as is', "forever"!
In this case it would be appropriate to also apply the factor to the Reports when they're created.
Obviously, if you set or change the factor through a period, then Reports will not = Usage Reports that month, they will only be = if the factor remains constant for the entire period (day/week,month).
But
If you change the factor frequently, based on your knowledge of the type of downloads/uploads at any point in time, then it would be better to use the factor every time the database is updated, i.e. every minute., in which case there would no longer be 'raw' totals.
Or
Two more columns could be added to the database [Usage] table which would contain the up/down 'factored' values, updated as above, so that it would be possible to compare 'raw' and 'factored' values should you want to.
The easiest change would be to simply apply the current factor to the Reports and Reports would then balance to Usage Reports (with the exception(s) being a period (day/week/month) where the factor has been changed).
The best change would be to add two columns for 'on-the-fly' factored values and add a switch to display either 'raw' or 'factored' on all reports, both e-mail and tabs. Then everything would balance, even when frequently changing the 'factor'.
J
|
Rod
Re: Usage report inconsistencies 27 February 2016, 11:21 |
My Time zone offset (mins) is zero; I'm in the UK and the report is generated at 00:00 daily. That much seems ok.
Looking at my hidden settings, my Usage adjustment (factor) is 1 so I suppose the raw data usage should be reported without adjustment.
There is a setting Hours shown in hourly report (0: unlimited) and I don't know what other settings there are or what they mean. It will accept any integer.
I suspect I might need to change this last setting but I don't know what I'm supposed to set it to to Report only metered usage.
|
Re: Usage report inconsistencies 27 February 2016, 11:51 |
Registered: 14 years ago Posts: 241 |
Rod, what's your hidden setting for [Show features related to on/off peak hours]?
If [False], then the grid is not shown on the [Advanced] tab and the only option under the [Display] icon is [All hours].
This is my setting because I'm on cellular and time-of-day is not used, I pay whenever I use the service.
If [True] then the grid is shown and you can designate which hours are On peak, Off peak and Unmetered.
You can then use the [Display] icon to show [All hours] or just either [On peak] or [Off peak] hours in the Usage reports but I have no idea if this impacts the e-mail Report since I don't use this. If I did use this then I'd want all hours to be coloured 'orange' for On peak.
J
edit:
If you do have both metered and unmetered hours set up then check if that's the discrepancy by comparing the e-mail totals with the [Display] icon options.
edit 2:
Hours shown in hourly report sets how many hours back from now are displayed in the hourly report. There are a lot of these records going back to when you started or last cleared your totals. Rather than display all in the hourly Usage report it might make sense to limit it to only showing the last 240 hours = 10 days (I think but it depends on whether there's activity in every hour of the last 240, etc.)
There's a row for each hour regardless of whether it's on peak, off peak or unmetered. But this is for the Usage report, don't know about the e-mail Report.
|
Re: Usage report inconsistencies 27 February 2016, 12:16 |
Registered: 14 years ago Posts: 241 |
|
|
Re: Usage report inconsistencies 27 February 2016, 16:27 |
Admin Registered: 19 years ago Posts: 3 650 |
QuoteRod
I have recently started to use the Report facility in Networx but I have noticed that the usage in a daily Report is not consistent with that in the "Per Day" usage tab.
Do the usage stats in the Report ignore unmetered hours in the same way as "Per Day" usage does or is the Report measuring something else?
Indeed any automatic report erroneously included ignored hours. Since very few users mark hours as ignored, this issue has been unnoticed for a while. Thanks for reporting it.
The new builds should fix the problem.
|
Rod
Re: Usage report inconsistencies 27 February 2016, 22:25 |
Thanks guys.QuoteAndrew
Indeed any automatic report erroneously included ignored hours. Since very few users mark hours as ignored, this issue has been unnoticed for a while. Thanks for reporting it. The new builds should fix the problem.
@Andrew
It occurs to me that an option to Report both metered and unmetered hours separately might be useful if it's not too difficult to implement.
|
Re: Usage report inconsistencies 27 February 2016, 22:31 |
Registered: 14 years ago Posts: 241 |
|
|
Re: Usage report inconsistencies 27 February 2016, 22:46 |
Admin Registered: 19 years ago Posts: 3 650 |
|
Re: Usage report inconsistencies 27 February 2016, 22:59 |
Registered: 14 years ago Posts: 241 |
|
|
Re: Usage report inconsistencies 27 February 2016, 23:10 |
Admin Registered: 19 years ago Posts: 3 650 |
|
Re: Usage report inconsistencies 27 February 2016, 23:18 |
Registered: 14 years ago Posts: 241 |
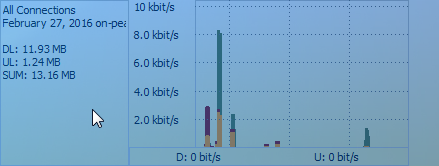
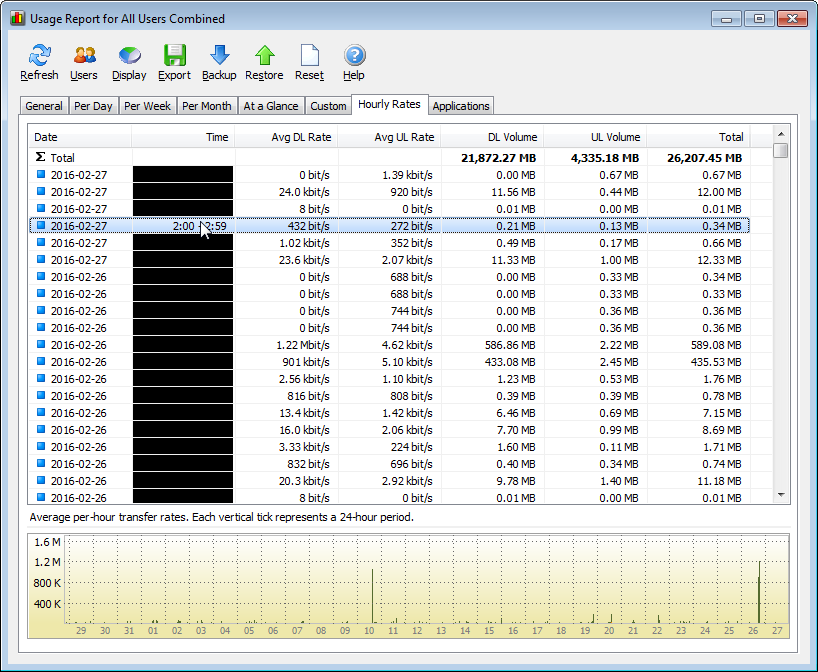
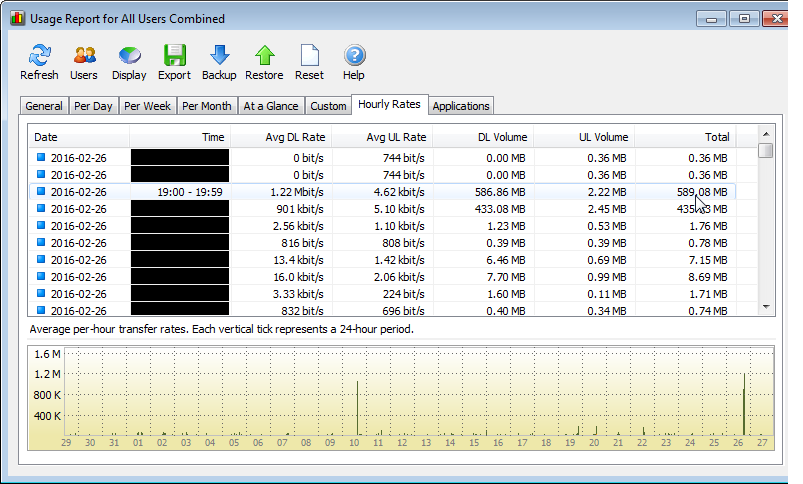
another thing, the avg DL & UL Rates on the hourly report are not really all that useful since the totals are averaged over 60 minutes whereas the figures should only include the number of minutes, e.g. 10, while actually DL & ULding during that hour and therefore the averages would be higher and more realistic.
In the attacment you can see a video download from a news site that started part way through one hourly period, stopped periodically (don't know why) then continued with another 'chunk', but all 'chunks' were at about 13mb/s, yet the report avg shows only 1.22mb/s & 901kb/s because it assumes the traffic was evenly spread over 60 minutes.
Of course that would require another column in the .db
J
Having MAX wouldn't help, for example if I downloaded from two different sites, one might be fast, the other slow, the averages meaningless for the hour and so too MAX. And likely MIN because there would be some minutes where there was zero traffic and MIN = zero.
|
Re: Usage report inconsistencies 27 February 2016, 23:28 |
Registered: 14 years ago Posts: 241 |
|
Rod
Re: Usage report inconsistencies 28 February 2016, 02:12 |
|
Rod
Re: Usage report inconsistencies 28 February 2016, 02:17 |
|
Praxis
Re: Usage report inconsistencies 28 February 2016, 02:35 |
Then you should be OK selecting [All hours].
The distinction was made because some plans can have all 3 categories with [On peak] charged at the highest rate, [Off peak] charged at a lower rate and [Unmetered] is free, all depending on the time-of-day. Folks with these plans only care about on & off peak which is why they are discrete options in [Display].
Folks billed by volume breaks only want [All hours].
Going back to your original post, how about some screen shots that show the discrepancy.
|
Re: Usage report inconsistencies 28 February 2016, 02:49 |
Registered: 14 years ago Posts: 241 |
Andrew,
Thanks to Rod and his coloured hours , I discovered that:
when the setting for [Show features related to on/off peak hours] is True, you've set the background colour for the Time column to be equal to the colour of on peak, off peak and unmetered
but
when the setting for [Show features related to on/off peak hours] is False, you've set the background colour to Black. It used to be White.
You should be able to reproduce this, it has nothing to do with the networx.db file unless there was a conversion of the db for this release.
J
Edit:
I did a little test,
- I changed [Show features related to on/off peak hours] to True and
- changed the colour for that hour to Green and
- created some traffic and
- checked and the Hours tab shows Green for that hour (Status = 'N') and Orange for everything else (Status = 'P').
I then closed NW and used sqlitebrowser to modify the Status of a different hour. When I checked, the Hours tab for that hour was also Green.
I then changed [Show features related to on/off peak hours] to False without actually reverting the hours colour in the Advanced tab, just to see what would happen. The background for everything was Black.
I haven't tried to determine the Status value for unmetered, but it looks like you check for background colours if 'True' but not if 'False'.
Edit 2:
Why not just always use the Status colours whether the setting [Show features related to on/off peak hours] is True or False. In my case the background would always be orange (instead of white, or right now black ). For those that want to separate the hours by on/off peak and unmetered, they still see the appropriate colours.
Thanks to Rod and his coloured hours
, I discovered that:
when the setting for [Show features related to on/off peak hours] is True, you've set the background colour for the Time column to be equal to the colour of on peak, off peak and unmetered
but
when the setting for [Show features related to on/off peak hours] is False, you've set the background colour to Black. It used to be White.
You should be able to reproduce this, it has nothing to do with the networx.db file unless there was a conversion of the db for this release.
J
Edit:
I did a little test,
- I changed [Show features related to on/off peak hours] to True and
- changed the colour for that hour to Green and
- created some traffic and
- checked and the Hours tab shows Green for that hour (Status = 'N') and Orange for everything else (Status = 'P').
I then closed NW and used sqlitebrowser to modify the Status of a different hour. When I checked, the Hours tab for that hour was also Green.
I then changed [Show features related to on/off peak hours] to False without actually reverting the hours colour in the Advanced tab, just to see what would happen. The background for everything was Black.
I haven't tried to determine the Status value for unmetered, but it looks like you check for background colours if 'True' but not if 'False'.
Edit 2:
Why not just always use the Status colours whether the setting [Show features related to on/off peak hours] is True or False. In my case the background would always be orange (instead of white, or right now black
). For those that want to separate the hours by on/off peak and unmetered, they still see the appropriate colours. |
|
Re: Usage report inconsistencies 28 February 2016, 11:32 |
Admin Registered: 19 years ago Posts: 3 650 |
The black background when on-peak/off-peak were hidden has been fixed in the latest build.
|
Re: Usage report inconsistencies 28 February 2016, 12:03 |
Registered: 14 years ago Posts: 241 |
QuoteAndrew
The black background when on-peak/off-peak were hidden has been fixed in the latest build.
confirmed
|
Rod
Re: Usage report inconsistencies 28 February 2016, 21:47 |
From an earlier post by Andrew, the problem has now been addressed (in a later build).QuotePraxis
Going back to your original post, how about some screen shots that show the discrepancy.
Due to an oversight, the Report did not ignore unmetered hours whereas the usage displayed in the "Per Day" tab does ignore them. This gave rise to the discrepancy between the two numbers.
|
Re: Usage report inconsistencies 28 February 2016, 23:51 |
Registered: 14 years ago Posts: 241 |
I was confused when you said everything was green yet you had unmetered hours. I expected the unmetered hours to be visible and coloured magenta.QuoteRod
FWIW my hourly rates are greened out - the colour (color) of off-peak usage in the Settings - Advanced tab.
I dug a little deeper and found that setting/changing the Status in the Hour table to "I" (Ignore), the traffic for that Day-of-the-week & Hour-of-the-day combination prevents the traffic stored in the Usage table from being shown in the Hourly report. Because only orange and green are used, there's no visible indication that unmetered has been set accidently, possibly leading to a discrepancy with ISP totals.
Therefore, your point:
might be a way to avoid confusion with the ISP totals.QuoteRod
It occurs to me that an option to Report both metered and unmetered hours separately might be useful if it's not too difficult to implement.