Histogram graph shows bumps and leaves gaps
5 posts · Closed
The histogram graph generates bumps, and when I switch to polyline, there are no bumps.
The chart also doesn't wrap all the way to the top like before; it leaves a gap.
Before, it was faster and easier to restart the graph by right-clicking on the same graph. This version regressed in quality. I paid for a license thinking it was improved, but I was wrong.
Please provide some screenshots of those 'bumps' and 'not wrapping to the top'. It will help us understand what you are referring to.
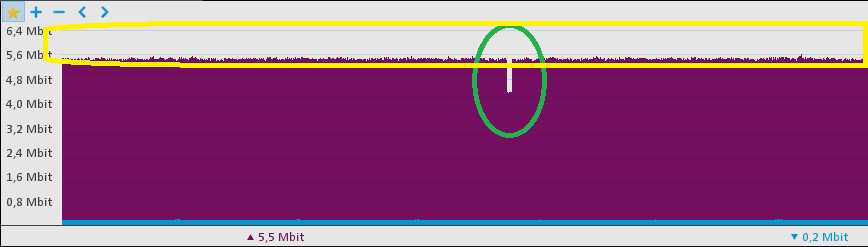
In yellow the graph is not filled to the top, before version 7 the graph was filled without leaving space above.
In green color I have those potholes but it only happens with the histogram graph
Thanks, it was indeed an oversight with the extra empty space above the graph. If you download the latest build and install it over your current installation, this issue should be resolved.
Unfortunately we have been unable to reproduce the drops so far, but we might be able to look into it better when we have more details about this issue, for example if some users can point out what exactly causes it.
Now the graph looks good on top with no space. Thanks.