Graph shows repeated drops and spikes after changing units
12 posts · Closed
Graph has a problem: it shows repeated drops and spikes after changing the units from bytes to bits.
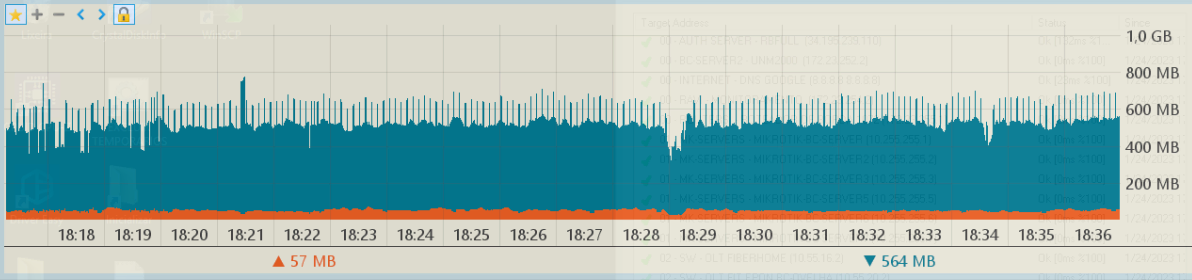
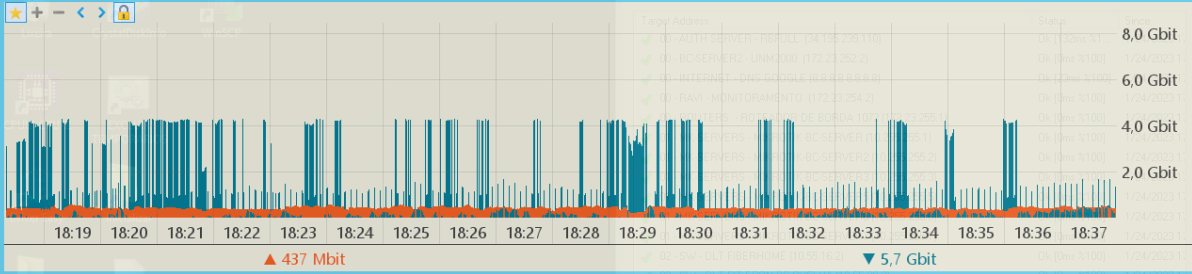
It may be specific to your configuration, so if you'd like us to have a look at it, please send us a copy of your config file:
- Go to Usage - Backup.
- Save it to a DB3 file.
- Compress the file to ZIP.
- Attach the compressed file to your message.
We would like to have a better look at your case, as in our tests the graphs look correct and identical:
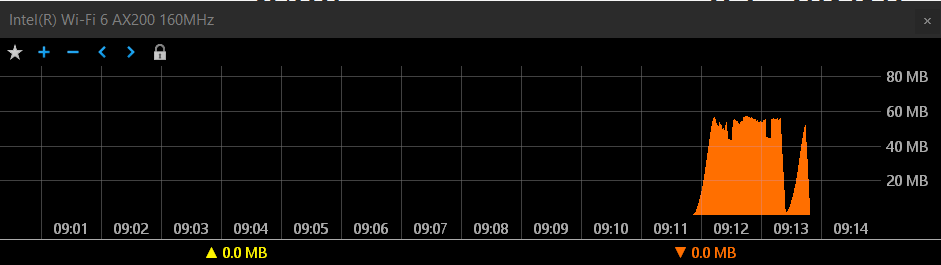
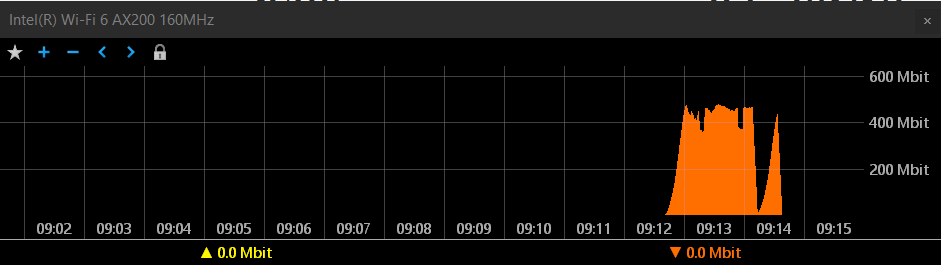
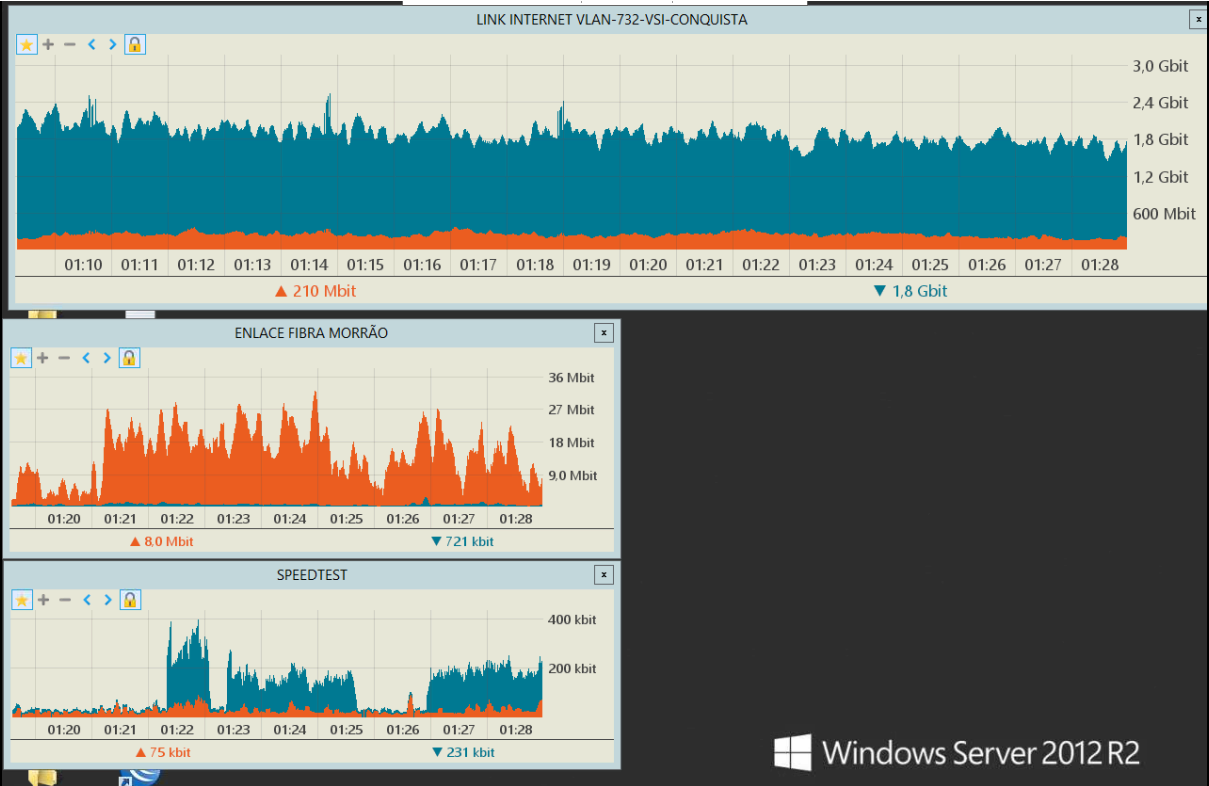
I'm monitoring a 10Gbps link and the graph looks buggy. Other slower links are looking normal.
I'm using the latest licensed version of Networx. In old versions of Networx the graph looks normal on the same link.
This seems to have been caused by a 32-bit counter rollover that was not handled correctly. Please try the new build and let us know how it works for you.
Still doesn't work :-(
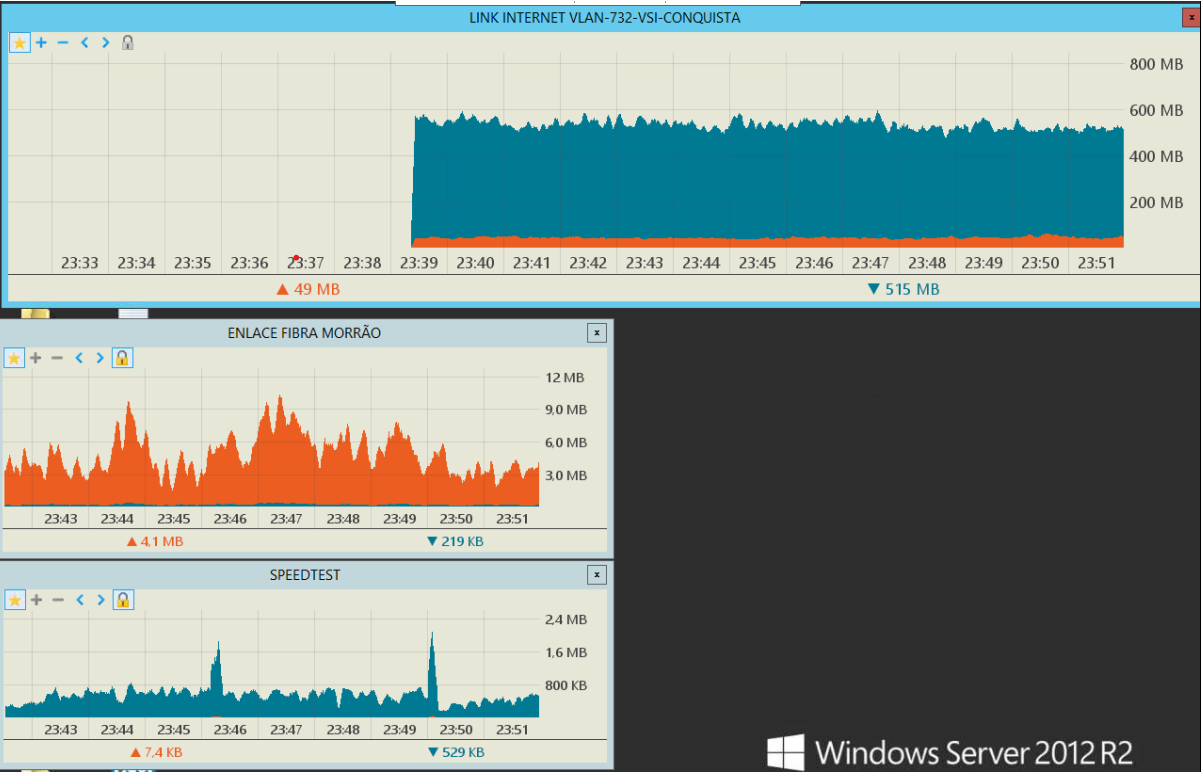
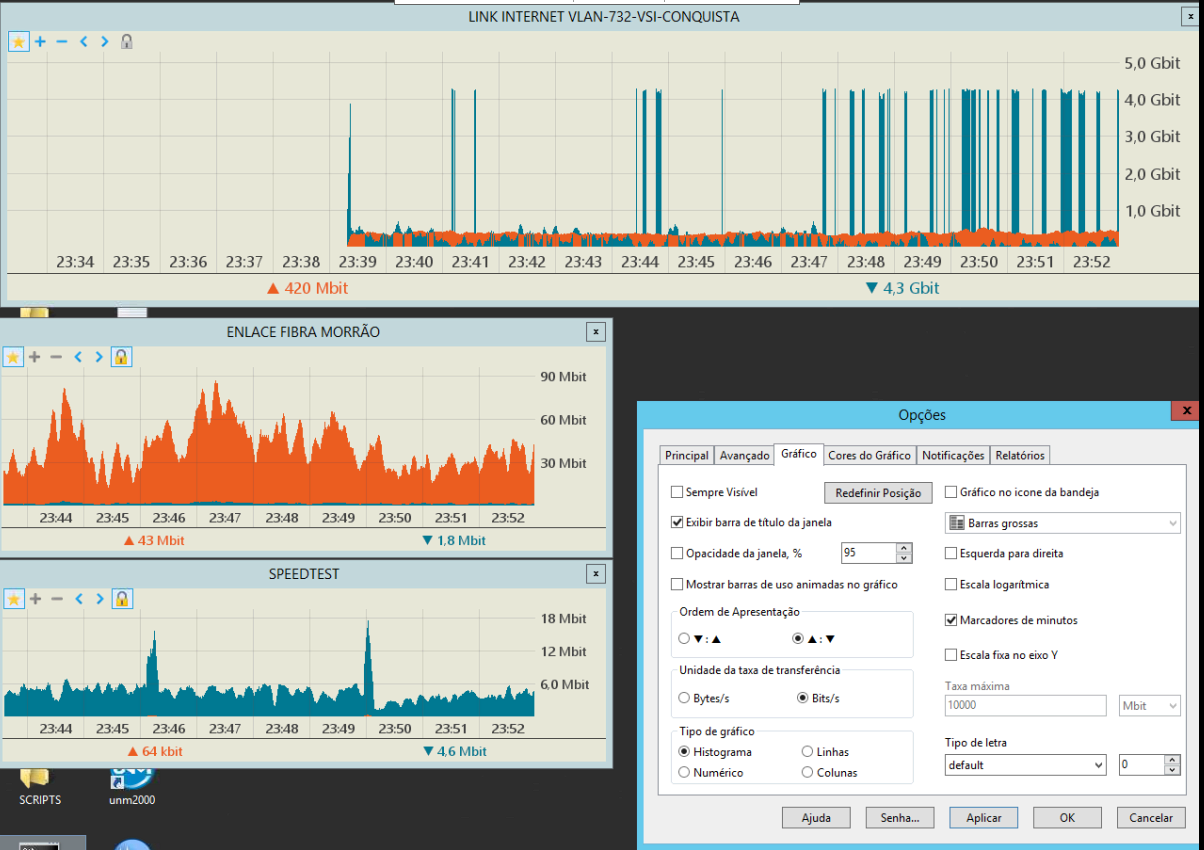
Looks like the new build only fixed the problem partially as the spikes present on the MB graph are gone:
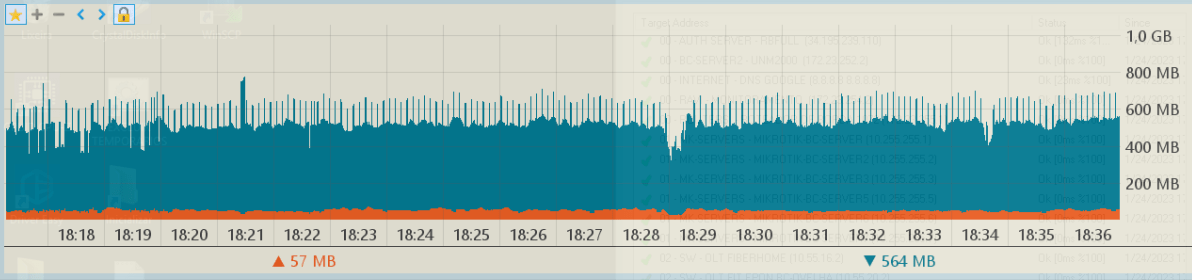
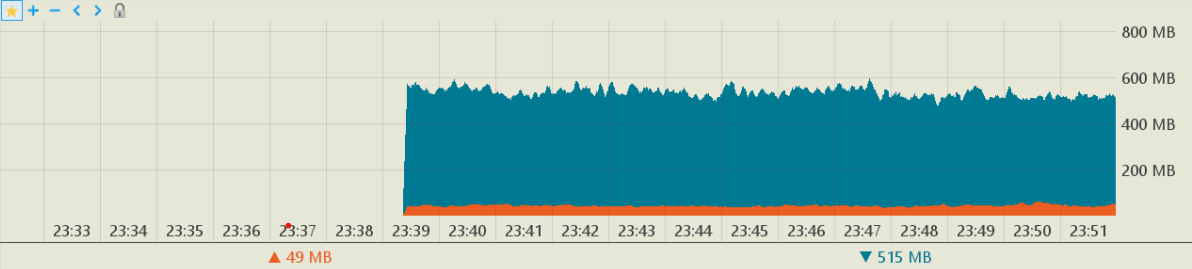
We will have another look into the spikes on the Gbit graph - it definitely looks wrong.
When the speed is lower (now it's at 2 Gbit), the graph seems to show everything correctly. When it's 4.5 Gbps or more, the graphics start to glitch.
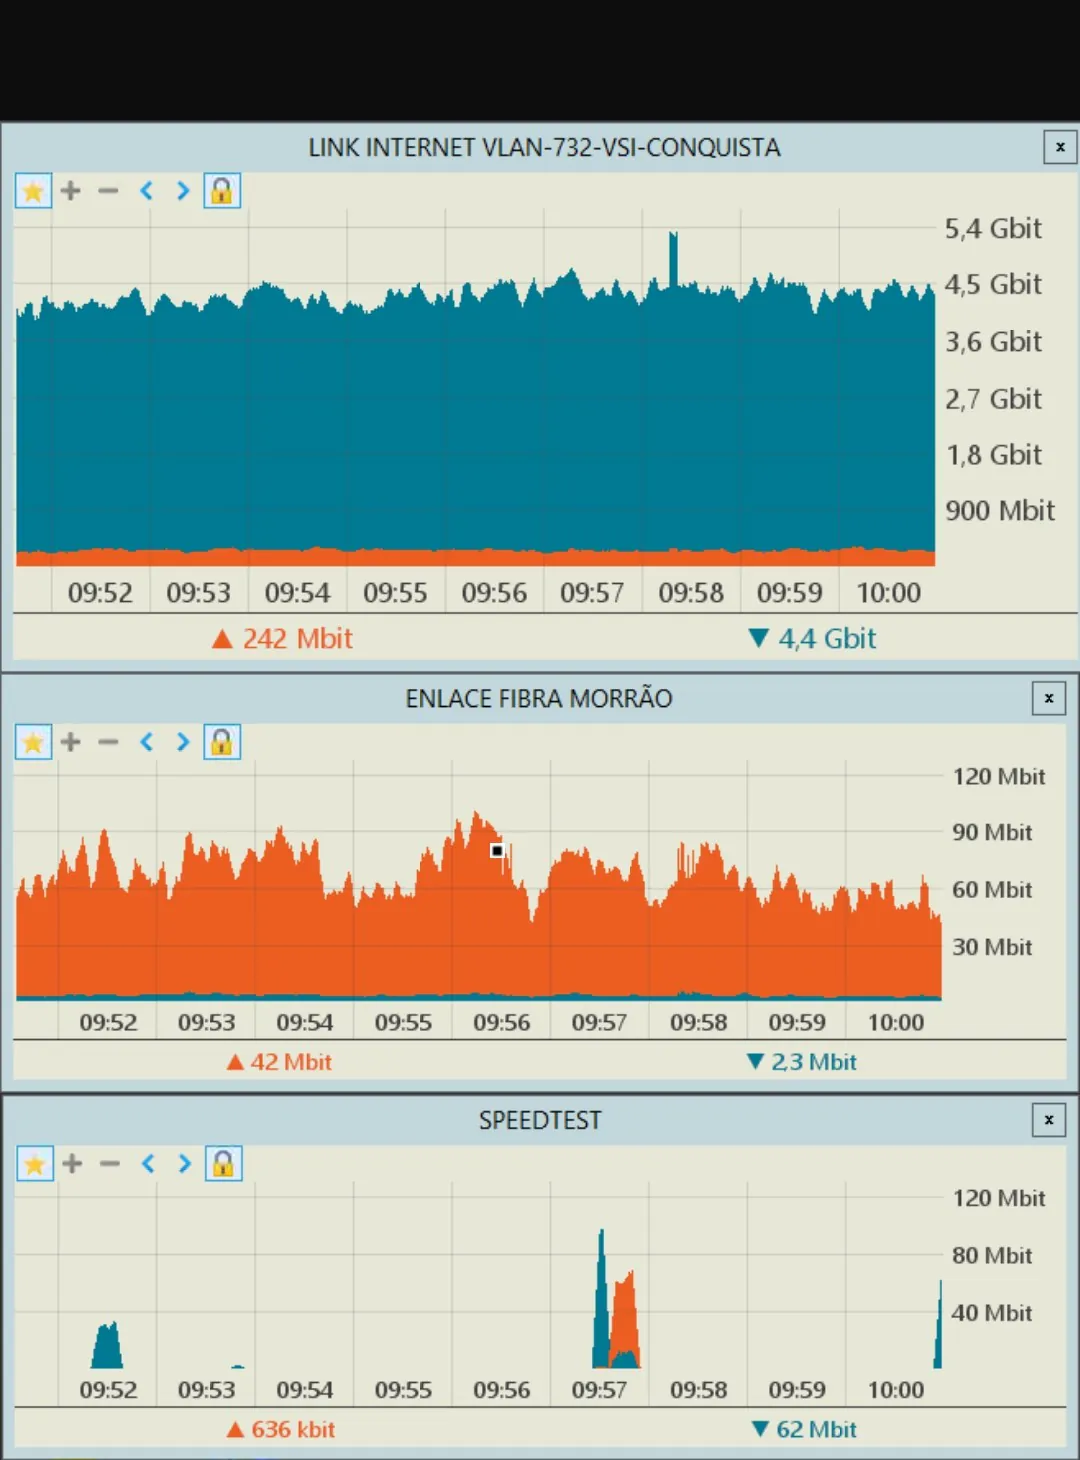
Indeed, this was caused by another 32-bit integer overflow at 4.2 Gbps mark (2^32). We have just fixed that by using a 64-bit integer.
Please download the new build and let us know how it works for you.
Seems to be working normally now.
Thanks Andrew :-)
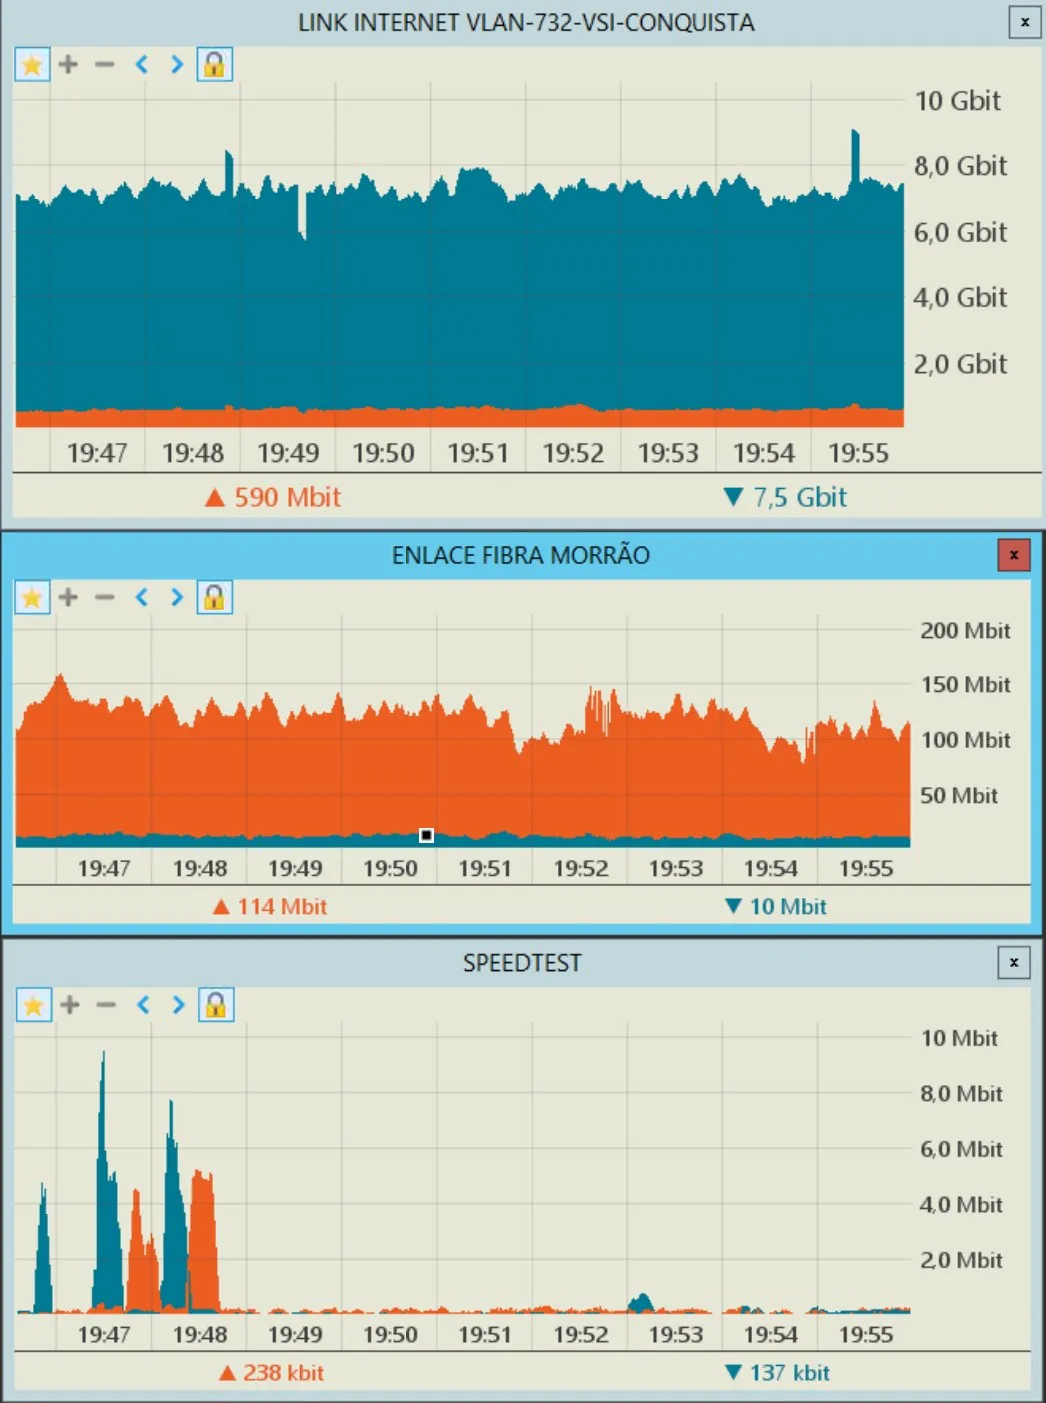
Great, thanks for reporting this issue. The fixes will be included in the next release.
Thank you! I was just going to write about this problem and discovered that the solution is already available. I'm very glad that I looked before writing :-)
You are great, as always.
I've been using NetWorx since mid 2000s.