Detail panel & graphs
The detail panel provides in-depth latency visualisation for the currently selected host. It appears alongside the table or tile view and updates in real time as new ping results arrive.
Showing and hiding the panel
To toggle the detail panel, use the View → Charts menu option or the corresponding toolbar button. The panel position and visibility are remembered between sessions.
Latency graph
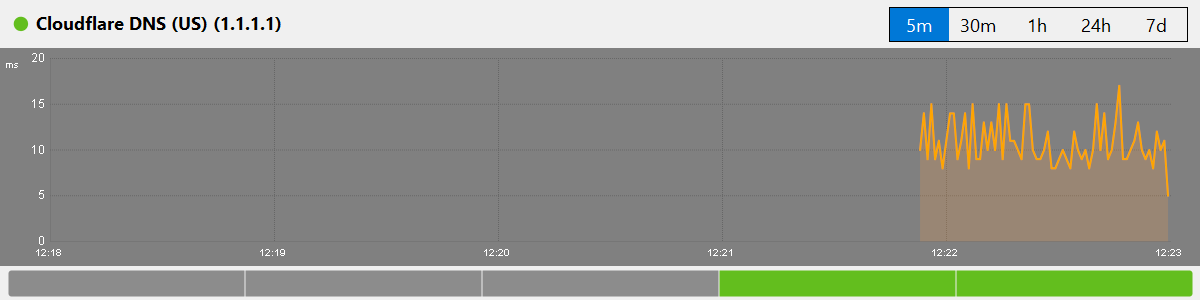
The main graph plots latency over time as a continuous line chart. The vertical axis shows latency in milliseconds; the horizontal axis shows time.
- Latency line: drawn in the colour scheme’s primary colour, showing the round-trip time for each ping.
- Jitter shading: a semi-transparent area around the latency line indicating jitter (latency variation).
- Loss markers: vertical red lines marking pings that timed out or were lost.
- Grid lines: horizontal and vertical reference lines for easier reading.
Time range selector
Above the graph, a set of time range buttons lets you choose how much history to display:
- 5m
- Last 5 minutes. Best for observing real-time behaviour and short-lived spikes.
- 30m
- Last 30 minutes. Good for identifying patterns over a short session.
- 1h
- Last hour. Useful for monitoring during a specific activity or test.
- 24h
- Last 24 hours. Shows daily patterns such as peak usage times.
- 7d
- Last 7 days. Provides a long-term overview for trend analysis.
Heat strip
Below the main graph, a 24-hour heat strip provides a compact quality overview for the past day. Each segment of the strip is colour-coded based on the average quality during that time period:
- Green: Good: low latency and minimal packet loss.
- Yellow: Degraded: elevated latency or some packet loss.
- Red: Critical: high latency, significant packet loss, or host unreachable.
- Grey: no data available for that period.
Colour schemes
The graph appearance is controlled by the active colour scheme. Seven built-in themes are available, and individual colours can be customised. The colour scheme affects the latency line, jitter shading, loss markers, background, grid and text colours. See Appearance settings for details on changing the scheme.
Your connection feels fine in the morning but stutters in the evening. Select the host, switch the time range to 24h, and look at the heat strip: if the amber and red segments cluster around the same hours each day, you are seeing congestion at peak times rather than a hardware fault. Switch to 7d to confirm the pattern repeats – solid evidence to take to your ISP.
Support teams tend to ask “have you rebooted the router?” until you show them numbers. Leave Ping Monitor running against a stable public host for a few days, then open the detail panel at the 7d range. The latency line and the red loss markers give you a clear, dated record of when the connection misbehaved – far harder to wave away than “it feels slow”.