Tile view
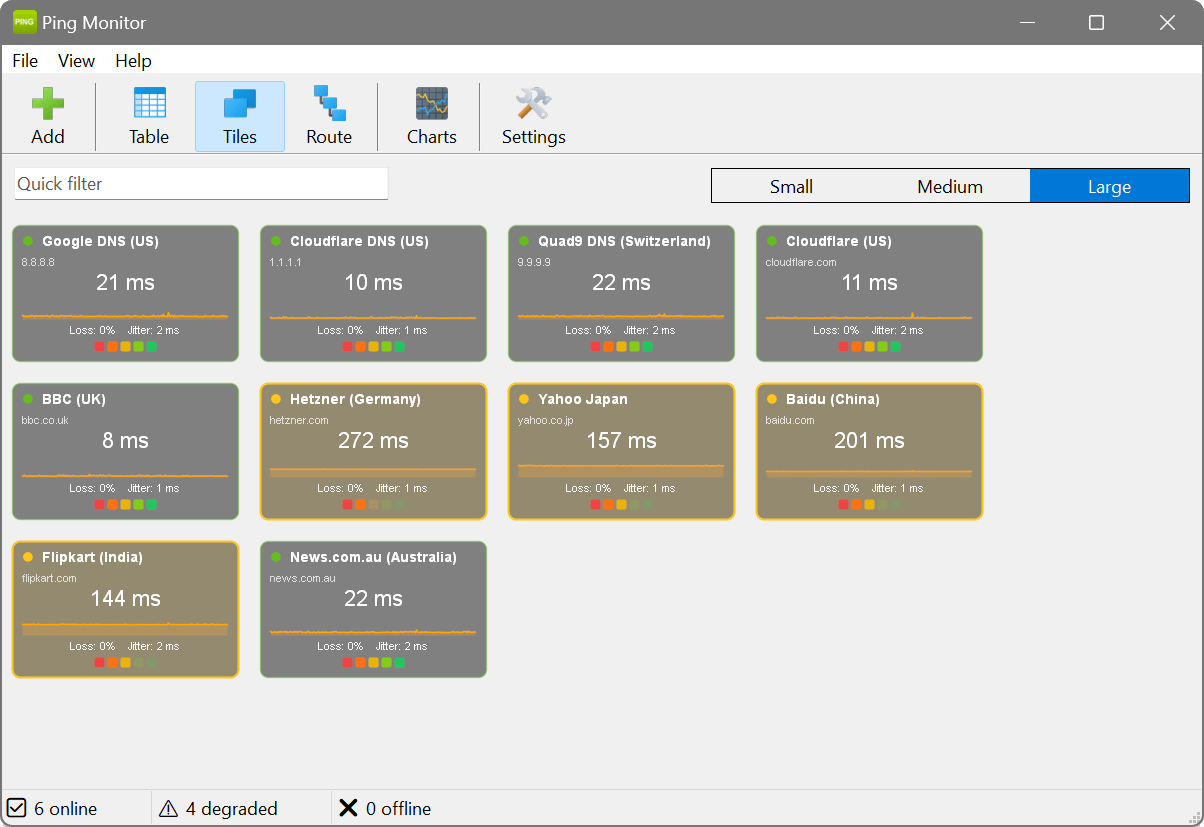
The tile view presents monitored hosts as a visual grid of tiles, each displaying the host’s status, latency and a sparkline graph at a glance. This view is ideal for dashboards and overview screens.
Tile sizes
Three tile sizes are available, selectable via the size switcher in the toolbar:
- Small (120 × 70)
- Compact tiles showing the host name, status colour and current latency. Best for monitoring a large number of hosts in a limited space.
- Medium (180 × 110)
- Includes the host name, status, current latency, packet loss, and a small sparkline graph.
- Large (240 × 150)
- Full-detail tiles with the host name, status, latency, packet loss, jitter, and a larger sparkline graph. Best for detailed monitoring of fewer hosts.
Status colour coding
Each tile’s background colour reflects the host’s current status:
- Green: Online and within the good latency threshold.
- Yellow/amber: Degraded: responding, but latency or packet loss exceeds the warning level.
- Red: Critical or offline.
- Grey: Unknown or disabled.
Switching tile sizes
Use the tile size switcher in the toolbar to change between small, medium and large tiles. The selected size is remembered between sessions. You can also change the default tile size in Appearance settings.
Interacting with tiles
Click a tile to select the corresponding host. If the detail panel is visible, it will update to display graphs for the selected host. Right-click a tile to access the context menu with options such as Edit, Remove, Pause/Resume Monitoring, and Trace Route.
Tags
If a host has tags assigned, they appear as small coloured squares on the tile. A tag filter bar above the grid lets you click one or more tags to narrow the view to hosts carrying them.
Put a spare monitor in the corner of the room and let it earn its keep. Add your key infrastructure, switch to tile view at the Large size, and maximise the window. Anyone walking past sees a wall of colour-coded tiles – green is calm, amber and red mean someone should look. The sparkline on each tile shows the recent trend, so you can tell a one-off blip from a host that is on its way down.
Watching dozens of hosts? Switch to the Small tile size to fit far more on screen at once. Each tile still carries the host name, status colour and current latency, so a single screen becomes a dense overview where any colour that is not green draws the eye immediately.