Table view
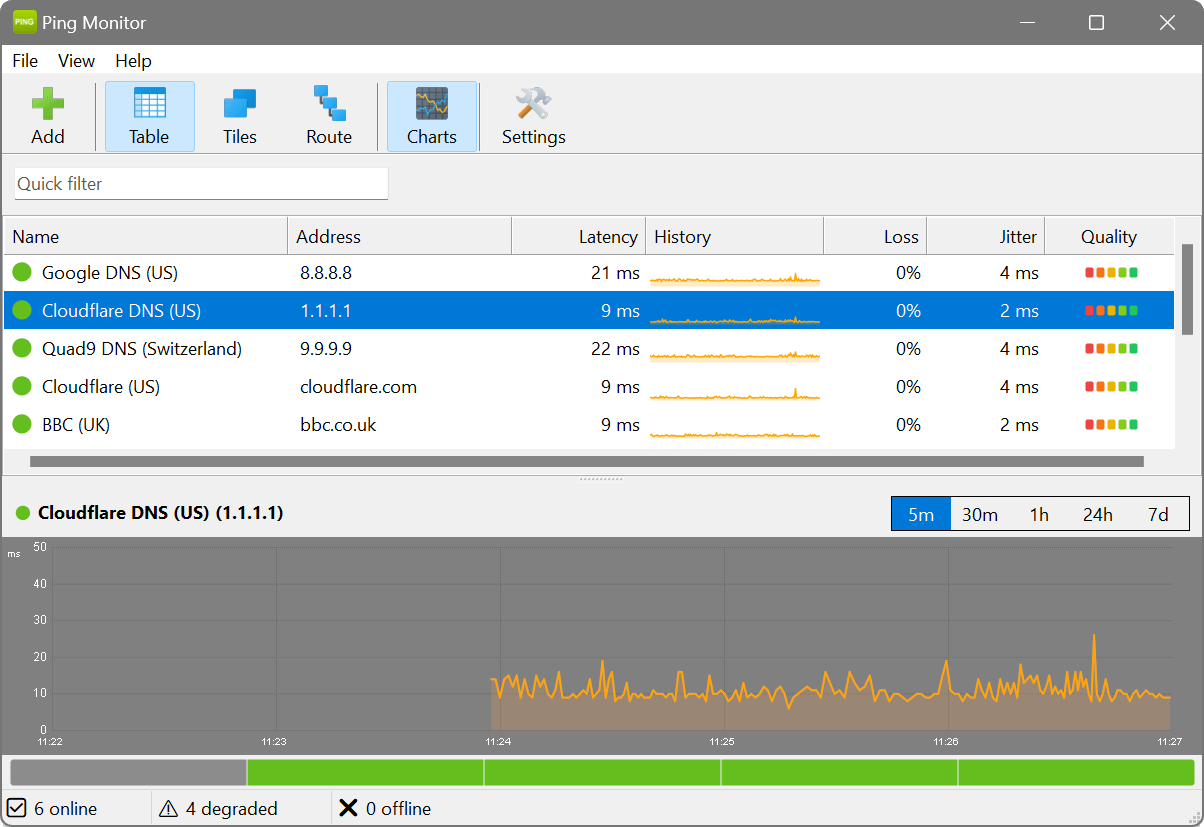
The table view is Ping Monitor’s spreadsheet-style home screen: every host on one line, every number in its own column, and a tiny history graph beside each. When you are looking after more than a handful of hosts, this is where you will spend most of your time – sort by any column and the trouble floats straight to the top.
Columns
The table displays the following columns:
- Name
- The display name of the host. If no custom name was provided when the host was added, the address is shown instead.
- Address
- The IP address or hostname being monitored. If a hostname was entered, the resolved IP address is used for pinging.
- Latency
- The most recent round-trip time in milliseconds. A dash (–) is shown if the host did not respond.
- History
- A sparkline graph showing recent latency values. Green indicates good latency, yellow indicates degraded, and red indicates critical or timed-out pings.
- Loss
- The packet loss percentage calculated over the recent history window.
- Jitter
- The variation in latency (in milliseconds) calculated as the average deviation from the mean.
- Quality
- An overall quality indicator combining latency, packet loss and jitter into a single assessment.
Status indicators
Each host displays a coloured status dot next to its name:
- Green: Online and responding within the “good” latency threshold.
- Yellow: Degraded: responding, but latency exceeds the degraded threshold or packet loss exceeds the warning level.
- Red: Critical or offline: latency exceeds the critical threshold, packet loss exceeds the critical level, or the host is not responding.
- Grey: Unknown: monitoring has not yet started, or the host is disabled.
Sorting
Click any column header to sort the table by that column. Click again to reverse the sort order. The current sort column and direction are indicated by an arrow in the column header.
Selecting hosts
Click a host to select it. The detail panel (if visible) will update to show graphs and statistics for the selected host. Right-click a host to access the context menu with options such as Edit, Remove, Pause/Resume Monitoring, and Trace Route.
Tags
If a host has tags assigned, they appear as small coloured squares right-aligned after the host name. A tag filter bar above the table lets you click one or more tags to narrow the list to hosts carrying them. This is useful for focusing on a particular group such as data-centre or VPN endpoints.
A user reports “the network feels slow” but will not say which service. Click the Loss column header to sort by packet loss, then the Latency column to sort by response time. The struggling hosts jump to the top, and their sparklines show whether the problem is constant or comes and goes. Select the worst one and the detail panel fills in the full picture.
Monitoring hosts for several sites in one window can get noisy. Give each host a tag for its site, then click that tag in the filter bar to hide everything else. The table now shows just that site’s hosts – perfect for a quick health check before a call – and a second click brings the rest back.