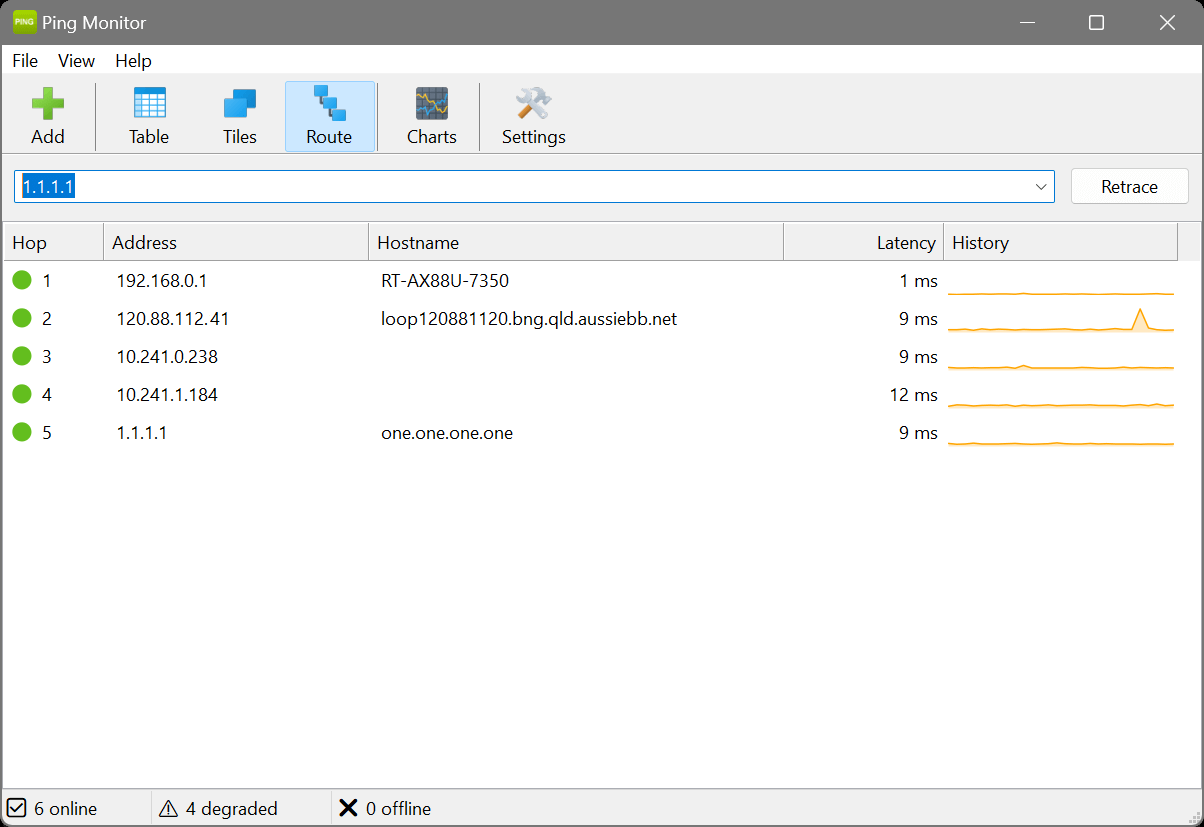
Route trace
The route trace view performs a traceroute to a selected host and displays the network path hop by hop. This is useful for diagnosing where latency or packet loss occurs along the route to a destination.
Starting a trace
To perform a route trace:
- Select a host in the table or tile view.
- Click the Trace button in the toolbar, or right-click the host and select Trace Route.
The view will switch to the Route tab and begin tracing the path to the selected host. Each discovered hop appears in the table as it is found.
Hop table columns
The route trace table displays the following columns:
- Hop
- The hop number (TTL value), starting from 1 for the first router in the path.
- Address
- The IP address of the device at this hop. An asterisk (*) indicates the hop did not respond.
- Hostname
- The reverse DNS hostname of the device, if available. Resolution is performed in the background.
- Latency
- The round-trip time to this hop in milliseconds.
- History
- A sparkline showing recent latency measurements for this hop, updated on each retrace cycle.
Retracing
Click the Retrace button to perform the trace again. This is useful for checking whether routing has changed or to gather more history data for each hop’s sparkline.
Interpreting results
When analysing a route trace, keep the following in mind:
- Increasing latency: a gradual increase in latency across hops is normal, especially over long distances.
- Sudden latency jump: a large increase at a specific hop may indicate a congested or slow link.
- Non-responding hops: some routers are configured not to respond to trace probes. A single non-responding hop (*) in the middle of a route is usually not a problem.
- Final hop not reached: if the trace ends before reaching the destination, a firewall or router may be blocking ICMP packets.
- Multiple paths: the route may change between traces due to load balancing. Retracing can reveal alternative paths.
A host you rely on has gone sluggish and you want to know whose problem it is. Trace the route to it and read down the hop list: if latency is fine through the first few hops (your own network and your ISP) and only jumps further along, the slowdown is out on the wider internet, not on your side. That single screen is often enough to settle a “your service is slow” argument – and to point your ISP at the exact hop where things go wrong.
Intermittent trouble that you cannot pin down? Trace the host, then click Retrace a few times and watch the hop sparklines build up. If the path or the per-hop latency keeps shifting between traces, you are likely looking at load balancing or an unstable link upstream rather than a fault at the destination.