Remote Performance
This feature reads Windows Performance Counters to obtain live system data such as CPU usage, memory statistics or process information. Choose Options → Remote Performance from the menu.
Prerequisites
The Remote Registry service must be running on the target device. By default this service is set to Manual startup on most Windows editions. If the service is stopped, the scanner cannot retrieve counter values from that device.
Configuration
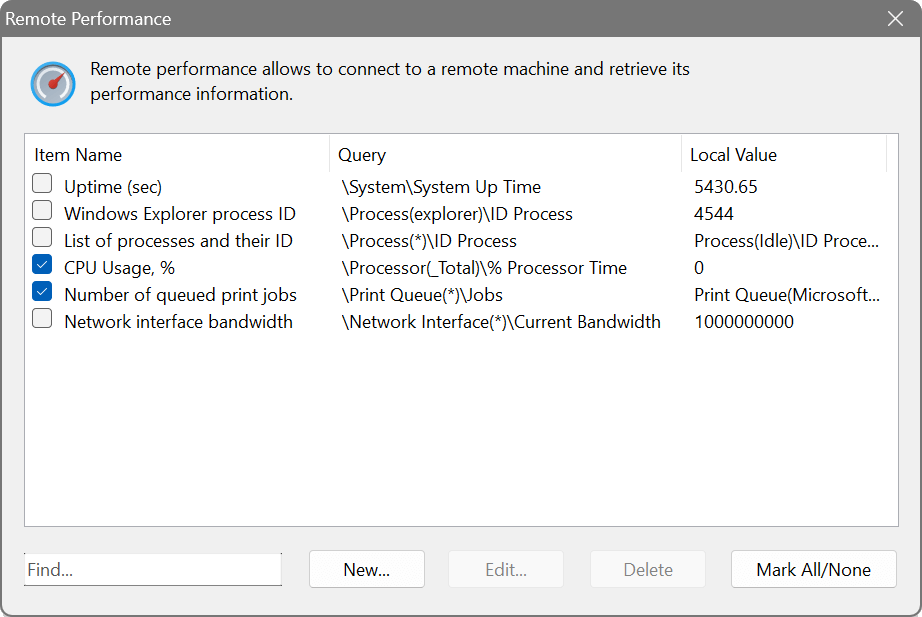
The dialog shows three columns: Item Name, Query and Local Value. When creating a new entry, type the counter path into the Performance Query field or click the browse button (…) to open the Windows counter browser. The browser lists all available counters on your local system grouped by category; select one and it will be inserted into the query field.
Counter paths must start with a single backslash, not a double backslash. The Local Value column shows the current reading from your own machine so you can verify the counter is working before scanning remotely.
Wildcard counters
You can use an asterisk in the instance name to query all instances at once. For example, \Process(*)\ID Process returns the process ID for every running process on the target device.
Useful counter paths
- \Processor(_Total)\% Processor Time
- Overall CPU usage percentage.
- \System\System Up Time
- Device uptime in seconds.
- \Process(explorer)\ID Process
- Windows Explorer process ID (indicates an interactive session).
- \Network Interface(*)\Current Bandwidth
- Network interface speed for all adapters.
- \Print Queue(*)\Jobs
- Number of queued print jobs.
Create a performance query for \Processor(_Total)\% Processor Time. After scanning, the column will show the current CPU usage on each device. Combined with background scanning, you can monitor CPU usage over time and be alerted when a server becomes overloaded.