Live monitoring
Besides point-in-time scanning, the Network Scanner can continuously watch devices in the results by pinging them every second. Monitored devices show their current latency, packet loss and jitter directly in the scan results, with a rolling one-hour record behind each figure. This makes it easy to keep an eye on critical hosts, or to watch a problem device while you work on it.
Starting and stopping
Select one or more devices, right-click and choose Monitoring → Begin Monitoring; choose Stop Monitoring the same way when done. Alternatively, tick Monitor all devices automatically on the Monitoring tab in scan options to have every discovered device monitored as it is found. Monitored rows are marked with a traffic-light bullet that follows the latency thresholds, and the status bar shows a live tally of devices in each state.
Monitoring columns
Monitored devices populate a Monitoring column group:

- Latency
- The current round-trip time.
- History
- A sparkline of recent response times.
- Loss
- The percentage of pings that went unanswered.
- Jitter
- The variation in response time.
- Quality
- An at-a-glance rating of the connection, from red to green.
The Monitoring tab in scan options sets the latency thresholds for the Good, Degraded and Critical states and lets you choose which of these columns are displayed.
Charts and route
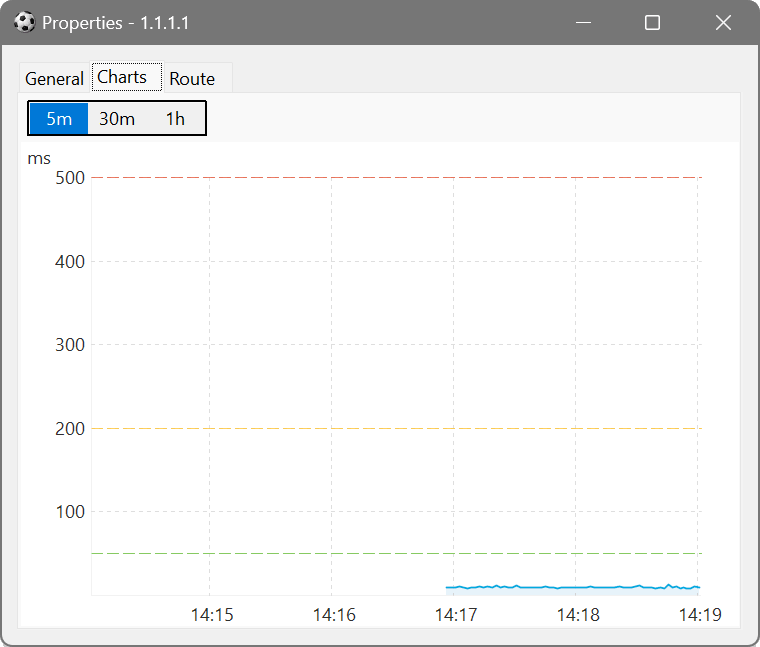
The device properties window of a monitored device gains two extra tabs. Charts plots the response time over the last 5 minutes, 30 minutes or hour, with the thresholds drawn as reference lines:
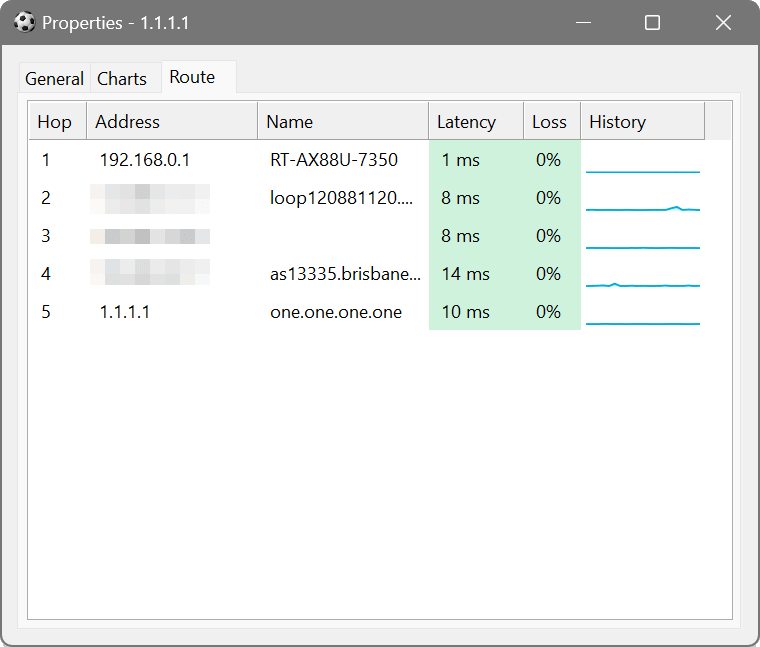
Route traces the path to the device and monitors every hop, colouring latency and loss by connection quality, so you can see at which point along the way a problem begins:
An open properties window keeps its device and history even if the results list is cleared or rescanned.
Suppose a printer intermittently drops off the network. Begin monitoring it, open its properties and keep the Charts tab visible while you swap cables or reconfigure the switch port. Every change is reflected within a second, and the chart shows at once whether the loss and latency spikes are gone.
When a remote host feels slow, open its properties and switch to the Route tab. Each hop along the path is monitored individually, so a congested uplink stands out: hops before it stay green while it and everything beyond turn amber or red. That tells you whether the problem is in your LAN, at the gateway, or out on the provider’s network.